
BreakoutBulletin | Macro & Rates Desk – May 19, 2026
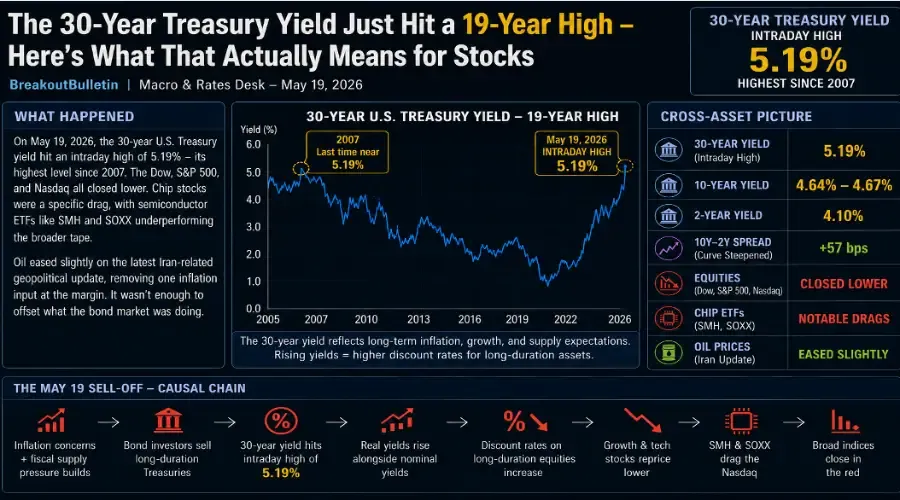
On May 19, 2026, the 30-year U.S. Treasury yield hit an intraday high of 5.19% – its highest level since 2007. If you weren't watching the bond market that day, you felt it anyway: the Dow, S&P 500, and Nasdaq all closed lower. Chip stocks were a specific drag, with semiconductor ETFs like SMH and SOXX underperforming the broader tape.
Oil eased slightly on the latest Iran-related geopolitical update, removing one inflation input at the margin. It wasn't enough to offset what the bond market was doing.
This post breaks down why the 30-year yield moving to these levels matters, how it reached equity markets, and what to watch for next.
What the 30-Year Yield Is Actually Telling You
Most traders watch the 10-year Treasury yield as the benchmark rate. The 30-year gets less attention – but right now it may be the more revealing signal.
The 30-year yield reflects what bond investors think about inflation and growth over a very long time horizon. When it rises sharply, it typically means investors expect inflation to stay elevated for longer, or they're demanding more compensation to hold long-duration U.S. debt – or both.
There's a third driver that doesn't get enough attention: supply. The U.S. government is running persistent fiscal deficits and issuing Treasuries at a relentless pace to fund them. At the same time, the Federal Reserve has been running Quantitative Tightening – shrinking its balance sheet by allowing bonds to roll off without reinvestment. That combination puts more long-dated supply into a market where the natural buyer base has shrunk. When supply outpaces demand structurally, yields rise – not just because of inflation expectations, but because the market needs a higher price to absorb the issuance. That's the term premium component, and in 2026 it's a meaningful part of why the 30-year is where it is.
Now, the number that really does the heavy lifting for equity valuations isn't the nominal 5.19% – it's the real yield, which is the nominal yield minus inflation expectations. If inflation is running at, say, 2.5%, a 5.19% nominal yield implies a real yield pushing past 2.5%. That level of real yield is a structural problem for high-multiple growth stocks, because it represents what bond investors are actually earning after inflation – and that's the rate equities have to compete against. The higher the real yield, the harder it is for growth stocks to justify their valuations.
The intraday 5.19% print was the headline. The closing level should be confirmed from your own data source, as intraday highs don't always represent where the market settled. What matters for ongoing analysis is whether the yield closed at or near that level – a sustained close rather than a brief probe changes the significance of the move.
What Drove the May 19 Selloff
Reuters tied the May 19 equity decline directly to inflation worries pushing yields higher. The Dow, S&P 500, and Nasdaq all closed lower. Semiconductor ETFs SMH and SOXX were notable drags – which fits the valuation mechanism above. Chip stocks carry high forward multiples, so rising real yields compress their valuations faster than lower-multiple sectors.
The causal chain ran like this:
Inflation concerns persist + fiscal supply pressure builds
→ bond investors sell long-duration Treasuries
→ 30-year yield hits intraday high of 5.19%
→ real yields rise alongside nominal yields
→ discount rates on long-duration equities increase
→ growth and tech stocks reprice lower
→ SMH and SOXX drag the Nasdaq
→ broad indices close in the red
Oil eased on the Iran update, which could have provided some inflation relief at the margin. In a different rate environment, softer oil might have been enough to support equities. On this session, the bond market move was large enough that it didn't offset the yield pressure in any meaningful way.
That asymmetry is worth noting. When long-end yields are moving decisively – especially when term premium and inflation expectations are both contributing – individual commodity moves tend to matter less than they would in a calmer rate environment.
Cross-Asset Picture
The 30-year yield is the headline number, but the broader yield picture adds context. The 10-year was sitting near 4.64–4.67% around this period. The 2-year was near 4.1%. That puts the 10Y–2Y spread at a positive 57 basis points – the curve has disinverted and steepened from its prior inverted state, reflecting a higher-for-longer structural environment rather than an easing cycle. A steeper curve in this context doesn't mean the market expects growth to accelerate – it may reflect rising term premium and fiscal concerns at the long end more than optimism at the short end.
Equities responded broadly to the downside. When the Dow, S&P 500, and Nasdaq all decline together, it typically signals a macro-driven move rather than sector-specific weakness. That's consistent with a broad yield-driven repricing rather than a single company or industry event.
Chip stocks and semiconductor ETFs – SMH and SOXX specifically – were notable drags within the session. High forward multiples plus rising real yields is a straightforward compression mechanism. The chip weakness on May 19 wasn't separate from the yield story – it was a direct expression of it.
Oil eased modestly after the Iran update, removing one inflation input at the margin without changing the broader yield picture.
Dollar and VIX weren't specifically quantified in the sourced stories for this session. The qualitative environment – broad equity declines, long-end yield spike, chip sector weakness – is consistent with a modest volatility pickup, but specific readings weren't available from the sourced material to confirm directionally.
Why a 19-Year High Matters Differently Now
The last time the 30-year yield was near 5.19% was 2007. At that point, the near-zero rate era hadn't happened yet. For roughly 15 years after 2008, rates stayed historically low – and that shaped how an entire generation of investors thought about equity valuation. Low real yields meant high multiples were justifiable, and the long-duration growth trade worked consistently in that environment.
The return toward 5.19% on the 30-year isn't just revisiting an old number. It may signal that the structural rate environment is settling into a genuinely different regime from the post-2008 era. The fiscal dynamic – persistent deficits, heavy Treasury issuance, QT reducing the Fed's footprint as a buyer – suggests the supply pressure on long-end yields isn't a short-term technical factor. It could be a more durable structural feature of the current environment.
Whether that regime is permanent is an open question. What it means for equity valuation right now is more concrete: higher real yields, compressed multiples on long-duration assets, and more scrutiny on whether a company's growth rate justifies its forward multiple in a world where risk-free real returns are meaningfully positive.
Structural Implications
The May 19 session reflects a cost-of-capital repricing driven by persistent inflation expectations and fiscal supply pressure – not a credit event or a growth scare.
That distinction matters. A yield-driven decline in equities doesn't necessarily mean earnings are deteriorating or that economic activity is slowing. It means the rate used to value those earnings has risen, which compresses valuations even when underlying business fundamentals are intact. That's a different kind of risk than a recession signal, and it calls for a different kind of response in how you think about portfolio positioning.
Long-duration assets – high-multiple growth stocks, long-maturity bonds, rate-sensitive sectors like utilities and real estate – may face continued pressure in an environment where the 30-year yield is holding near these levels. That pressure could ease if inflation data softens meaningfully, if Treasury issuance slows, or if the Fed signals a clearer path toward cuts. Until one of those conditions changes, the current yield level may continue to act as a ceiling on growth equity valuations.
Breadth on May 19 was broad to the downside. Capital didn't visibly rotate into defensives or value in a way that would suggest a sector rotation rather than a macro move. The broad decline across all three major indices suggests the yield move was large enough to affect the overall risk environment.
Portfolio Context
For growth-heavy investors, a 30-year yield near 5.19% with rising real yields is a direct input to how the market is valuing current portfolio holdings. High-multiple names – particularly in tech and semiconductors – carry embedded sensitivity to discount rate moves. Sessions like May 19 make that sensitivity explicit rather than theoretical.
For defensive investors, the yield environment is a double-edged consideration. Higher yields on Treasuries make bonds more attractive on a yield-to-maturity basis for new purchases. But existing long-duration bond holdings face mark-to-market losses as yields rise. Duration of existing fixed income exposure matters as much as the direction of rates.
For balanced portfolios, the challenge is that a yield-driven selloff tends to pressure both equities and long-duration bonds simultaneously – which reduces the typical diversification buffer between the two asset classes. In this specific macro environment, the correlation between stocks and bonds may be higher than in a growth-shock or credit-shock scenario.
What to Watch Next
The May 19 move doesn't resolve itself automatically. A few specific things could either confirm the yield pressure or begin to ease it:
Next inflation print (CPI/PCE): If the next inflation reading comes in softer than expected, it could ease inflation expectations at the long end and reduce some of the nominal yield pressure. If it comes in hotter, the 5.19% intraday high may get tested again – or exceeded.
Treasury auction results: The U.S. Treasury conducts regular auctions of long-dated debt. Weak auction demand – reflected in a high yield at auction, low bid-to-cover ratios, or poor dealer takedown – would confirm that the supply pressure described above is real and ongoing. Strong auction demand could provide a near-term cap on long-end yields.
Federal Reserve communication: Any Fed speaker commentary that shifts the language around the rate path – particularly around when cuts might become appropriate – can move long-end yields quickly. Watch for any deviation from the current higher-for-longer framing.
SMH and SOXX price action: If semiconductor ETFs stabilize or recover even as the 10-year and 30-year yields hold elevated, it could indicate that the chip sector has partially priced in the current rate environment. If they continue to underperform on days when yields tick higher, the yield-to-semis transmission chain described above is still active.
10Y–2Y spread direction: The curve has steepened to a positive 57 basis points. If that spread continues to widen – meaning the 30-year and 10-year rise faster than the 2-year – it may indicate that term premium and fiscal concerns are the dominant driver rather than near-term inflation expectations alone. That's a different macro signal than a curve steepening driven by rate cut expectations.
Bigger Picture
The 30-year yield briefly touching 5.19% on May 19 reinforces rather than introduces the current macro regime.
Inflation hasn't resolved. Fiscal deficits and Treasury issuance aren't slowing. QT is still reducing the Fed's footprint as a bond buyer. Together, these factors may keep upward pressure on long-end yields even if near-term inflation data occasionally surprises to the downside.
What the May 19 session added to the picture is a confirmation that long-end yields at these levels produce broad equity pressure – not just in rate-sensitive sectors, but across the Dow, S&P 500, and Nasdaq simultaneously. The breadth of that impact is worth understanding clearly as the rate environment continues to evolve.
This isn't a crisis signal. It's a regime signal. The cost of capital is higher than it was for most of the past decade, and markets are still in the process of figuring out what that means for valuations across asset classes.
This analysis is based on Reuters and CNBC coverage from May 19, 2026, covering the 30-year Treasury yield move and its transmission into U.S. equity markets. It is produced for educational purposes only and does not constitute financial advice, investment recommendations, or trading instructions. The 5.19% figure referenced is an intraday high – confirm the closing level from your own data source before using it as a reference point. Always verify data independently before incorporating it into any trading decision.