
Published: June 2, 2026 | Category: Catalyst Deep Dive | Read time: 5 min
All figures and derived thresholds in this post are based on publicly available data. Actual outcomes can differ materially.
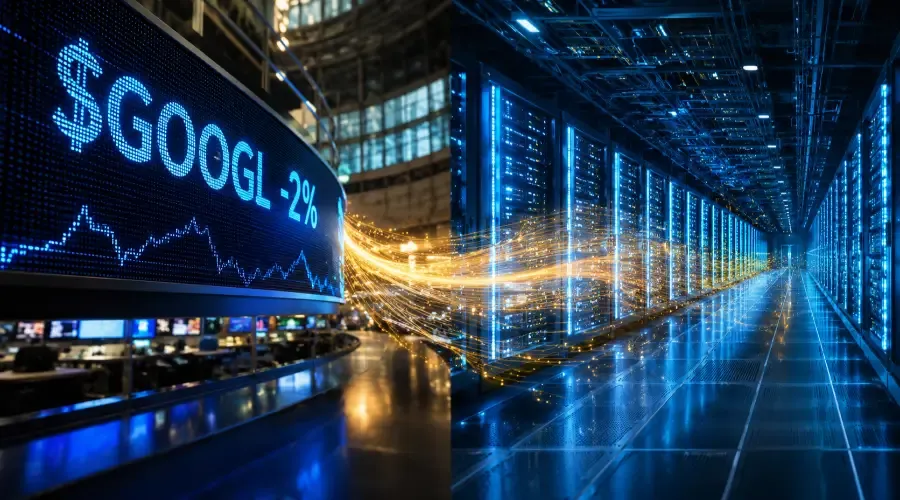
Alphabet ($GOOGL) dropped roughly 2% after disclosing an $80 billion stock sale plan. Most of the coverage framed this as investors punishing the company for dilution.
That framing is probably wrong.
A 2% move on an $80B raise for a company generating $64.4B in trailing twelve-month free cash flow is not a crisis reaction. It is a modest adjustment to a financing event.
The actual story is one layer deeper. Alphabet is guiding toward $180B–$190B in AI infrastructure capex in 2026. That is roughly 2.9 times its current annual free cash flow.
The question worth asking is not whether Alphabet can fund this – it clearly can. The question is whether the AI infrastructure buildout earns its cost of capital over the next six to eight quarters.
The Anatomy of the $80B Raise
Rather than hitting the market all at once, the capital injection is divided into three distinct, strategic tranches.
1. The Institutional Anchor: Immediate / Private Placement
A $10 billion private placement split evenly between Class A and Class C shares sold directly to Berkshire Hathaway. This is a direct institutional placement that avoids open-market pressure. Berkshire's existing relationship with Alphabet means this is an expansion of a known position rather than a new outside vote of confidence.
2. The Underwritten Offering: Public Tranche
A $30 billion underwritten public offering managed by investment banks. This tranche heavily utilizes mandatory convertible preferred securities and common stock to split the immediate equity impact.
3. The At-The-Market (ATM) Program: Deploying Q3 2026 and Beyond
A $40 billion flexible pool slated for later in the year. This functions as an administrative mechanism to match share delivery with employee equity tax withholdings, preserving cash rather than forcing a single large dilutive event.
The verified numbers
| Metric | Verified Figure | Source & Core Context |
|---|---|---|
| Total Equity Raise | $80B | June 1, 2026 SEC Filing |
| Berkshire Placement | $10B | Private placement (Class A & C) |
| Underwritten Offering | $30B | Mandatory convertible preferred + common |
| ATM Program | $40B | Deploying Q3 2026+ for equity tax withholding |
| 2026 CapEx Guidance | $180B–$190B | Upgraded from $175B–$185B in Q1 call |
| TTM Free Cash Flow | $64.4B | Q1 2026 10-Q |
| Q1 2026 FCF | $10.1B | Front-loaded infrastructure builds |
| Google Cloud Momentum | 63% YoY ($20B+) | Primary driver of multi-billion AI backlog |
| CapEx-to-FCF Ratio | ~2.9x | Calculated midpoint against TTM FCF |
The capex return math
At a $185B capex midpoint against $64.4B in TTM free cash flow, Alphabet is committing to spend roughly 2.9 times its current annual free cash flow on AI infrastructure.
That scale of investment is not unusual for a platform-scale technology company in a major buildout cycle. But it does create meaningful pressure on FCF conversion over the next several quarters.
Q1 2026 free cash flow already compressed to $10.1B due to front-loaded infrastructure builds. That is a real data point, not a projection. It tells you the capex cycle is already flowing through the financials.
The 2% stock drop on this news may reflect short-term sensitivity to dilution optics rather than a fundamental reassessment of Alphabet's earnings power. With $64.4B in TTM FCF, the company has the financial capacity to absorb this financing cycle.
The open question is what returns the infrastructure spending generates.
Where the capex returns will show up
The AI infrastructure buildout is not an operating expense. It is an investment with a return timeline.
The returns from $180B–$190B in capex will surface primarily in two places over the next six to eight quarters.
Google Cloud revenue growth is the most direct signal. If the AI infrastructure investment is generating real enterprise demand for Google Cloud services, that shows up in accelerating cloud revenue.
Google Cloud has been growing at roughly 63% YoY, generating over $20B and driving a multi-billion dollar AI backlog. Any sustained acceleration above that baseline would be consistent with the capex cycle producing returns. Deceleration would raise questions about whether the infrastructure investment is generating proportional demand.
AI product monetisation is the second signal. Alphabet has been deploying AI across Search, Workspace, and advertising products.
Revenue yield from these products relative to the infrastructure cost is the longer-term return metric. But early signals may be visible in Search and advertising revenue per query trends.
Three things to monitor going forward
1. Google Cloud revenue growth rate quarterly
This is where capex returns surface first. The 63% YoY baseline is your reference point. Acceleration above that is the positive signal. Any deceleration would raise questions about whether the infrastructure investment is generating proportional demand.
2. FCF margin trend over the next two quarters
As capex ramps, FCF margin will likely compress from current levels. The question is by how much and whether it stabilises.
Q1 2026 FCF already came in at $10.1B. If quarterly FCF continues to compress toward a run rate consistent with the third-party $41.7B annual estimate, that would indicate higher capital intensity than the current guidance implies.
3. Management commentary on AI product monetisation timelines
Any language about when Gemini, AI Overviews, or Workspace AI features reach meaningful revenue contribution relative to infrastructure spend. This tells you the timeline on capex return visibility.
What this means in practical terms
If you own GOOGL: The 2% drop is probably not a signal about Alphabet's fundamental health. The capex math is manageable for a company at this FCF scale.
The variable to track is whether Google Cloud and AI product revenue accelerates to justify the investment. That data arrives quarterly.
If you are watching from the sidelines: The capex-to-FCF ratio of roughly 2.9x is the frame to hold in mind.
At that ratio, FCF per share will likely compress over the next two to three quarters before recovering as infrastructure investments generate revenue. How long that compression lasts depends on how quickly AI infrastructure demand converts to billable Cloud and advertising revenue.
If you hold no position: The most useful preparation is noting the TTM FCF of $64.4B and the $185B capex midpoint now. Those two numbers are your baseline for evaluating every quarterly result over the next two years.
FAQ
What does capex-to-FCF ratio tell a retail trader?
The capex-to-FCF ratio shows how much a company is spending on infrastructure relative to the cash its operations actually generate. A ratio above 1 means the company is spending more than it brings in through free cash flow. In Alphabet's case, 2.9x indicates a heavy investment cycle. The ratio is useful because it gives you a baseline for tracking whether that spending eventually produces enough revenue to close the gap.
How do you measure AI capex return for a company like Alphabet?
AI capex returns typically show up first in cloud revenue growth. When a company builds AI infrastructure, enterprise customers pay to use that infrastructure. If cloud revenue accelerates, it suggests the spending is generating demand. The second signal is AI product monetisation – whether features like Gemini or AI Overviews produce measurable revenue relative to what they cost to build and run. Tracking these two data streams quarterly gives you a practical way to monitor whether large-scale AI capex is paying off.
This analysis is for educational purposes only and does not constitute investment advice. All figures are based on Alphabet's publicly available disclosures, SEC filings, and Q1 2026 10-Q as of June 2, 2026. The $41.7B annual FCF estimate is a third-party derived model, not company guidance, and is labelled as such. Please consult a qualified financial advisor before making investment decisions. BreakoutBulletin does not hold positions in any securities mentioned.