
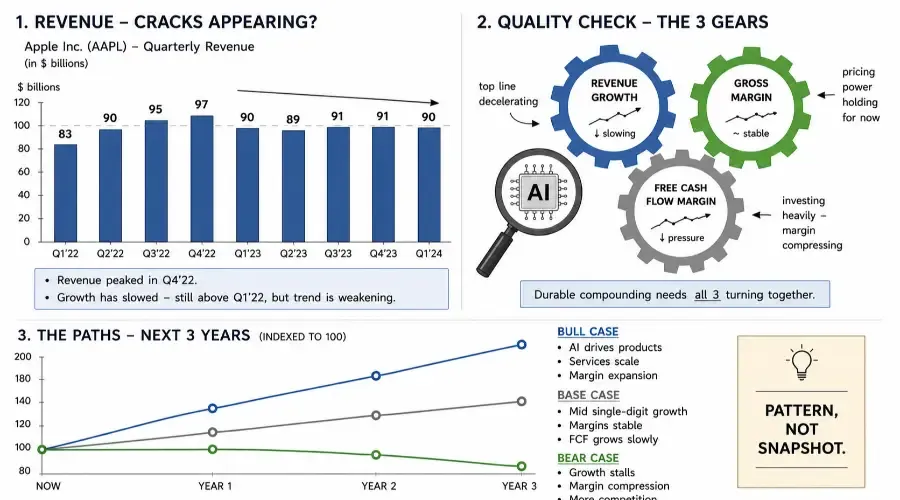
Revenue growth gets the headlines. Margins and cash flow tell you whether the growth is worth anything.
A company growing revenue at 30% annually is impressive. A company growing revenue at 30% annually while compressing margins and generating less free cash flow than it did two years ago is a different proposition – one that often isn't visible until the market has already started pricing the deterioration.
The three metrics this post covers – revenue growth rate, gross margin trend, and free cash flow margin – work as a quality filter. No single one tells the complete story. The pattern across all three, examined over multiple periods, identifies businesses that are genuinely compounding value versus those buying growth at a cost they haven't yet disclosed. AI processes this pattern efficiently when you give it the right data and the right questions.
Growth, margin, and cash flow analysis is the quality verification layer in the Fundamental Research with AI workflow. It covers the full hub overview and how this step validates or challenges what the screening and ratio analysis revealed.
Why Growth Alone Is Not Enough
Revenue growth measures top-line expansion only. It says nothing about whether the cost structure is scaling efficiently, whether the business generates cash above its investment requirements, or whether reported earnings bear any relationship to cash reality.
Three patterns make this visible. A company can grow revenue by acquiring customers at a loss – impressive top-line expansion while cash burns. It can grow by adding capex at a rate exceeding incremental revenue generated, creating a gap between reported growth and cash generation. Or it can grow by compressing margins – more units at lower prices – reducing the economic value of each additional revenue dollar.
None of these are automatically disqualifying. But they need to be visible. Margin trajectory and cash flow analysis is what makes them visible.
The Three Metrics to Analyse Together
Revenue Growth Rate – Trajectory Over Level
A growth rate is most informative as a trajectory, not a point-in-time reading. 25% growth means something different if the prior three periods were 45%, 35%, and 30% – a clear deceleration – versus 10%, 15%, and 20%, which signals acceleration. Always include at least four periods so the model can assess direction. Include in your prompt: "identify whether the revenue growth trajectory is accelerating, decelerating, or stable across the periods provided."
Gross Margin Trend – The Profitability Quality Indicator
Gross margin measures how efficiently the core business converts sales into the profit base that funds everything below it. A gross margin expanding 200 basis points or more year-over-year – for example, from 58% to 60.2% – is a meaningful positive trend indicating improving unit economics or pricing power. A high absolute margin that is declining consistently is a warning signal even if the level remains impressive.
Free Cash Flow Margin – The Cash Reality Check
Free cash flow margin – free cash flow as a percentage of revenue – tells you how much of each revenue dollar the business converts into real cash after maintaining its asset base. Benchmarks vary significantly by sector: for capital-intensive businesses, above 20% is strong; for asset-light software businesses, strong FCF margins typically exceed 30% to 40%, and 20% would indicate underperformance relative to peers.
For companies with negative FCF margins – common in early-stage biotech, capital-heavy growth businesses, and pre-profitability technology – the relevant question is not whether FCF is negative but whether the investment driving the negative FCF is finite and productive. Ask the model to assess whether the capex driving negative FCF is declining as a percentage of revenue over time (suggesting the investment phase is ending) or growing (suggesting it is ongoing and structural).
Valuation ratios and cash flow analysis work as a pair. How to Evaluate Valuation and Financial Ratios Using AI covers the valuation side, including how to contextualise P/FCF against sector peers and the company's own history.
Pro-Tip – Non-GAAP Reconciliation: When reviewing the cash flow statement, check the 10-Q reconciliation table. Companies frequently highlight "Adjusted EBITDA" which excludes stock-based compensation, making them appear cheaper than they are. The prompt below forces the model to compare GAAP net income against actual SBC, stripping away that adjustment.
Formatting the Data for AI Input
Source both the income statement and cash flow statement from SEC filings – 10-Q for quarterly data, 10-K for annual. Structure the paste to show four to eight quarters side by side. A note on seasonality: for retail, consumer, or any business with seasonal revenue patterns, compare the same quarter year-over-year rather than sequentially – a drop in Q1 FCF for a retailer may be entirely normal and misleading if read as sequential deterioration.
| Period | Revenue | Gross Margin % | Net Income | SBC | Operating CF | CapEx | FCF | FCF Margin % |
|---|---|---|---|---|---|---|---|---|
| Q3 2024 | 2,388 | 80.1% | 149 | 234 | 489 | 67 | 422 | 17.7% |
| Q2 2024 | 2,229 | 79.9% | 70 | – | 417 | 81 | 336 | 15.1% |
| Q1 2024 | 2,127 | 79.6% | 209 | – | 381 | 72 | 309 | 14.5% |
| Q4 2023 | 2,098 | 79.3% | 97 | – | 348 | 88 | 260 | 12.4% |
The Prompt
Act as a fundamental analyst reviewing [Company]'s growth, margin, and cash
flow data across [N] quarters.

Financial data: [paste table]

Based only on the data I've provided:

(1) Assess the revenue growth trajectory – accelerating, decelerating, or
stable? Quantify the change in growth rate between the earliest and most
recent period.

(2) Assess the gross margin trajectory – expanded, compressed, or stable?
Quantify the change in basis points from earliest to most recent period, and
identify any inflection point where trend direction changed.

(3) Assess the FCF margin trajectory – improving, deteriorating, or stable?
Identify whether changes are driven primarily by operating cash flow or by
capital expenditure. If FCF margin is negative, assess whether capex intensity
as a percentage of revenue is declining over time (investment phase ending)
or growing (structural ongoing requirement).

(4) Assess the relationship between net income and operating cash flow. If
operating cash flow is consistently below net income, identify the most likely
cause from the data. Distinguish between temporary divergence – acceptable
in fast-growing companies due to working capital absorption – and persistent
widening divergence, which warrants deeper investigation.

(5) If a SBC figure is provided, quantify its relationship to GAAP net income
across the periods and explain what this means for economic earnings available
to shareholders versus the reported GAAP figure.

(6) If any period is missing a required figure – operating CF, capex, or gross
profit – flag the analysis as incomplete for that period rather than
estimating or omitting.

Preserve all figures exactly as provided. Do not introduce external data.
Format using Markdown headers. Bold key findings.
End with: **Overall Quality Assessment: [IMPROVING / STABLE / DETERIORATING]
due to [Primary Factor].**
The Earnings Quality Check – Net Income vs Operating Cash Flow
In a stable, mature business, net income and operating cash flow should track reasonably closely over time. For a rapidly growing business, temporary divergence is normal and expected – working capital requirements expand as the business scales, absorbing cash through inventory build, receivables growth, and supplier payment patterns. This is not a red flag.
What warrants investigation is persistent, widening divergence over multiple periods. The most common causes: revenue recognised before cash is received (accounts receivable growing faster than revenue); inventory build outpacing sales; or accounts payable compression as supplier credit terms tighten. When operating cash flow is consistently below net income and the gap is widening, ask the model which pattern in the data is most consistent with the divergence – and whether the divergence has been narrowing or widening.
The opposite divergence – operating cash flow consistently exceeding net income by a large margin – is most often explained by significant stock-based compensation, which is added back in the cash flow reconciliation. This is not a quality concern in the same sense, but it does represent ongoing equity dilution that the FCF figure alone doesn't reflect.
Margin trends and cash flow quality are often most visible in the earnings call transcript before they show up in the financial statements. How to Analyze Earnings Transcripts with AI covers how to extract the management commentary on margin trajectory and cash conversion that fills in the context behind the numbers.
Palantir Q3 2024 – Walkthrough
Palantir is an instructive case because its FCF picture is strong while its GAAP earnings picture is complicated by significant SBC.
Data (from Palantir's 10-Q filings):
| Period | Revenue | Gross Margin % | Net Income | SBC | Operating CF | CapEx | FCF | FCF Margin % |
|---|---|---|---|---|---|---|---|---|
| Q3 2024 | 726 | 80.2% | 149 | 234 | 420 | 14 | 406 | 55.9% |
| Q2 2024 | 678 | 80.4% | 134 | 229 | 397 | 15 | 382 | 56.3% |
| Q1 2024 | 634 | 79.8% | 106 | 223 | 388 | 14 | 374 | 59.0% |
| Q4 2023 | 608 | 79.6% | 210 | 218 | 410 | 11 | 399 | 65.6% |
| Q3 2023 | 558 | 78.3% | 72 | 212 | 339 | 13 | 326 | 58.4% |
| Q2 2023 | 533 | 78.2% | 28 | 207 | 294 | 14 | 280 | 52.5% |
What the output identified:
Revenue growth trajectory: stable to modestly accelerating – consistent sequential growth across all six periods with no deceleration visible.
Gross margin: expanded 200 basis points from 78.2% to 80.2% over six quarters – a sustained and meaningful improvement indicating more efficient revenue conversion.
FCF margin: ranging 52.5% to 65.6% – exceptional by any sector standard, driven by extremely low capex intensity of approximately 2% of revenue, consistent with an asset-light software model.
Net income vs operating cash flow: operating cash flow ran consistently and substantially above GAAP net income across every period. The model identified the driver immediately: SBC of $234 million in Q3 2024 exceeded GAAP net income of $149 million. Adding back non-cash SBC in the cash flow reconciliation explains why operating cash flow reached $420 million – approximately 2.8x GAAP net income.
The SBC assessment: the FCF margin of 55.9% is real and strong. But SBC running above net income means the company is distributing economic value to employees through equity at a rate exceeding GAAP profit generated. Shareholders experience ongoing dilution that the FCF figure alone doesn't reflect. A trader valuing Palantir on an FCF multiple needs to factor this in – strong FCF yield and meaningful ongoing dilution are both true simultaneously.
Where This Fits in the Research Process
This analysis belongs in the fundamental research phase, after screening and ratio contextualisation have identified a company worth examining deeply. It is the quality verification layer – confirming that business quality implied by ratio metrics is consistent with actual financial statement detail.
Data gathering takes 15 to 20 minutes from SEC filings. The AI analysis takes 10 to 15 minutes. The verification pass – confirming critical figures against actual filings – takes 5 to 8 minutes. The output is a quality assessment no screener or ratio table alone can produce: the pattern of how the business is actually converting growth into sustainable economic value, with the specific flags that deserve follow-up before committing capital.