
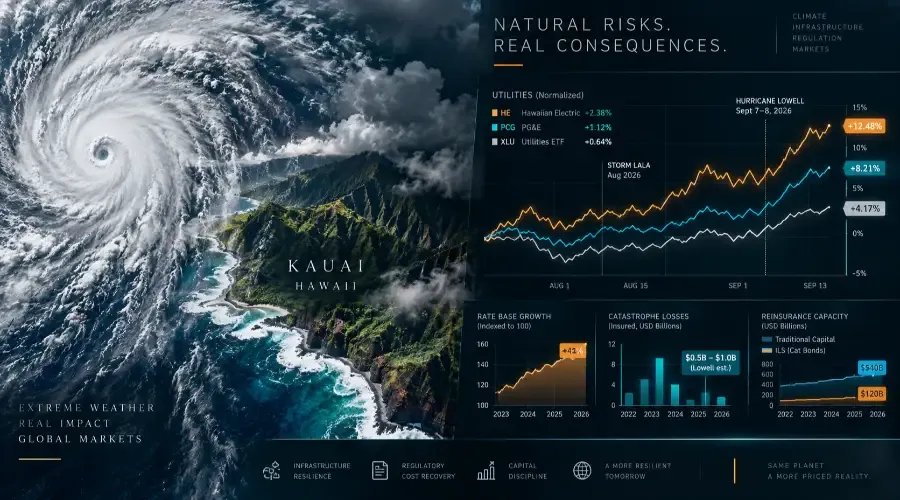
A preliminary insured-loss estimate of $0.5 billion to $1.0 billion is grabbing headlines, but an aggregate catastrophe loss number is never an equity exposure map. The documented, investable channel runs through utility cost-recovery mechanisms, and that balance-sheet pressure was already in motion before the storm made landfall.
When a tropical cyclone threatens land, the market's initial reflex is familiar: attempt to identify which commercial or homeowners insurer took the direct hit and trade the sector. Hurricane Lowell which passed west of Niihau and Kauai as a Category 2 system on 7–8 September has prompted that exact reaction. Early estimates from Cotality peg insured industry losses between $0.5 billion and $1.0 billion, centered on Kauai, while Hawaii Governor Josh Green independently projected localized infrastructure damage exceeding $400 million.
Trading that headline reflex is fundamentally flawed. Early modeled loss ranges do not allocate claims by specific carrier, Property Claims Services (PCS) will not deliver formal carrier-level loss assessments for weeks, and anyone claiming to identify which insurer bears the brunt today is guessing.
The actionable institutional question is different. It is not which primary insurer absorbs Lowell; it is who pays for infrastructure rebuilds, which layers of damage qualify under commercial insurance, and what portion of restoration expenses utility regulators will allow companies to pass into their rate base. Reframing the event around regulatory recovery points away from property insurers and directly at regulated utilities.
Why an Insured-Loss Estimate Is Never an Exposure Map
A modeled estimate of "$0.5 to $1.0 billion" conveys a false sense of mathematical precision. It fails as a stock-selection tool for three structural reasons.
First, insured loss does not represent total economic damage. A substantial share of hurricane destruction, specifically storm surge and valley flooding is uninsured or falls upon state-maintained infrastructure like roads, harbors, and distribution grids. Standard homeowners policies explicitly exclude flood peril, shifting water losses to the National Flood Insurance Program (NFIP) or private flood underwriters, while wind-driven damage frequently requires separate policy endorsements. Because Lowell’s core hurricane-force winds stayed offshore, physical damage was driven primarily by rainfall-induced valley flooding, coastal swell, and peripheral wind gusts rather than catastrophic structural collapse.
Second, insurance coverage is layered across distinct policy forms. Structural envelope damage, localized grid failures, and business-interruption claims sit across separate underwriting books and retentions. Observing a roof stripped from a commercial building reveals nothing about which carrier underwrote the primary layer, what deductible applies, or whether commercial claims survive business-interruption waiting periods.
Third, the modern catastrophe reinsurance market insulates primary balance sheets through complex capital structures. Where net losses ultimately land depends on company-specific attachment points, treaty retentions, and catastrophe bond triggers. Until individual carriers report formal claims volumes, case reserves, and reinsurance recoveries, modeled industry numbers remain theoretical aggregates.
The Documented Channel: Utility Cost-Recovery Mechanics
The primary SEC-disclosed exposure tied to Hawaiian weather risks is not an insurance filing. It is Hawaiian Electric (HE), and the operational risk was documented before Lowell even arrived.
In a Form 8-K filed on 4 September 2026, Hawaiian Electric disclosed financial fallout from earlier weather events specifically Tropical Storm Lala and the Kona storm system documenting $25 to $30 million in operating expenses and $30 to $40 million in capital expenditures. Crucially, management warned that 20% to 25% of the storm operating expenses might be deemed ineligible for recovery by the Hawaii Public Utilities Commission (PUC), with insurance recoveries remaining unresolved.
This dynamic illustrates the real equity transmission channel. An electric utility deploys capital immediately to restore substations, poles, and transmission wires. Only after the grid is energized does it petition regulators for permission to defer and amortize those emergency outlays through customer rate adjustments. Expenses disallowed by regulators, alongside insurance policy deductibles, flow directly against corporate net income rather than into the capital rate base.
Lowell does not act in isolation. It represents the second tropical cyclone to menace Hawaii within three weeks (following Lala’s Big Island landfall in August) and the fifth tropical system to threaten the islands within three months. When multiple storms hit in a single quarter, the fundamental question shifts from single-event damage to cumulative recovery friction and regulatory balance-sheet capacity.
The Long-Term Balance Sheet Overhang: Maui Wildfire Liabilities
Any evaluation of Hawaiian Electric’s financial resilience must account for its legacy liabilities. The 2023 Maui wildfires remain the central anchor on the company's capital structure.
While HE achieved a definitive $4.0 billion global settlement with tort and subrogation claimants—securing Hawaii Supreme Court validation in early September 2026—the operational drag remains significant. The utility satisfied initial closing conditions and completed its first $479 million annual installment on 10 April 2026, committing the company to four consecutive years of heavy cash outflows. While the legal settlement eliminated existential bankruptcy tail risk, funding recurring settlement tranches while managing unreimbursed restoration capex severely constrains balance-sheet flexibility.
How Catastrophe Risk Converts into a Utility Financing Challenge
To understand how repetitive physical hazards alter utility equity performance over a multi-year horizon, look at Pacific Gas & Electric (PCG).
On 2 September 2026, PG&E announced plans to defer approximately $2 billion of scheduled 2027 investment, trimming its forward capital expenditure budget to $11.4 billion from $13.4 billion and curtailing its forward debt-issuance requirements by an identical sum. Management explicitly cited constraints tied to California's wildfire-liability framework as the operational driver for review.
The comparison highlights a universal structural pattern: for capital-intensive regulated utilities, catastrophe risk rarely presents as a simple, one-off insurance settlement. It manifests as a persistent financing and credit-rating friction. Disallowed emergency restoration costs, heightened borrowing spreads on storm-recovery bonds, and deferred capital improvements suppress the forward rate-base expansion that underpins earnings-per-share growth.
The Reinsurance Counterweight: Ample Capital vs. Tight Aggregate Cover
A persistent rule of thumb holds that major storms harden property-casualty reinsurance pricing, providing a direct margin tailwind to global underwriters. Current market capitalization complicates that thesis.
Data from AM Best demonstrates that property-catastrophe reinsurance capacity exceeded market demand by more than 25% during mid-year renewals, supported by a record $17.3 billion in 144A catastrophe bond issuances throughout the first half of 2026. Total dedicated reinsurance capital sits at record levels: approximately $540 billion in traditional capital supplemented by $120 billion in Insurance-Linked Securities (ILS).
The critical market dynamic in 2026 is contract structure rather than gross capital volume.
Per-occurrence coverage responds to a single designated event up to an agreed policy limit. In contrast, annual-aggregate coverage indemnifies against the cumulative exhaustion of multiple medium-sized disasters occurring within a policy year. Catastrophe bond issuances have rotated heavily toward per-occurrence protection (representing 63.9% of outstanding risk capital as of September 2026) while annual-aggregate structures have contracted to roughly 39.4% of the market. Consequently, even in an environment flush with global reinsurance capital, primary insurers and municipal utilities must retain a higher proportion of losses from repetitive, mid-tier storms because aggregate safety nets have been systematically dismantled.
Documented Exposure Across US-Listed Equities
The table below outlines verified operational exposure channels drawn from corporate SEC filings and official state assessments, stripping out unsubstantiated trading narratives:
| Exposure Category | Documented Companies & Tickers | Documented Regulatory / Filing Data | What Filings Do Not Support |
|---|---|---|---|
| Direct Utility Cost-Recovery | Hawaiian Electric (HE) |
Form 8-K (filed 4 Sept 2026): $25–30M opex, $30–40M capex from prior storms; 20–25% opex flagged nonrecoverable. Active $4B Maui settlement ($479M annual cash payments). | Any quantified Lowell-specific loss reserve, restoration cost estimate, or confirmed PUC disallowance. |
| Utility Financing (Macro Comparator) | Pacific Gas & Electric (PCG) |
Announced $2B capex deferral for 2027 (reducing budget from $13.4B to $11.4B) citing wildfire framework financing terms. | Direct connection to Hawaii losses; cited strictly as a peer framework comparator. |
| P&C Underwriters & Reinsurers | Diversified US P&C, Reinsurance Baskets | Cotality preliminary estimate ($0.5B–$1.0B total insured); record H1 cat bond capacity ($17.3B issued, AM Best). | Any carrier-specific market share allocation or net retention loss estimates at this stage. |
| Sector Monitoring Vehicles | KIE(Insurance), IAK (P&C), XLU(Utilities) |
Structural multi-asset sector ETF exposure tracking rate changes, reinsurance yields, and grid capital outlays. | Specific fund-flow rotations or asymmetric storm-related trading setups. |
| Kauai Infrastructure & Tourism | Local Municipal & Hospitality Equities | State reports confirm extensive utility disruption (power cut to ~90% of Kauai meters) and marine port delays. | Quantified earnings impairment without individual corporate SEC disclosure. |
Thesis Tracking Matrix
Rather than trading early press releases, track these concrete operational and regulatory milestones to confirm whether the utility capital thesis holds or unwinds:
| The Thesis Strengthens If... | The Thesis Weakens If... |
|---|---|
| Hawaiian Electric's subsequent PUC filings confirm storm repair costs exceeding initial budget caps with low insurance recovery. | Hawaiian Electric reports minor incremental damage and secures prompt, 100% regulatory deferral approval. |
| Revised Cotality and PCS insured loss totals settle at or above the upper $1.0B boundary. | Formal claims counts come in significantly below early modeled catastrophe ranges. |
| PG&E’s structural review results in permanent capital budget reductions or further credit rating agency downgrades. | Legislative or regulatory adjustments clarify utility liability frameworks, stabilizing borrowing spreads. |
| Reinsurance renewals continue cutting annual-aggregate capacity, forcing higher net retention on primary balance sheets. | Catastrophe reinsurance capital expands back into aggregate layers, softening primary carrier retention risk. |
Bottom Line & Takeaways
Top-line storm headlines focus on insured losses. The actionable reality is that modeled loss numbers are the least informative metric in the initial days following landfall.
Insured loss does not equal total infrastructure damage, primary policies are heavily layered across wind, flood, and municipal retentions, and the real financial pressure point centers on utility cost-recovery and capital deferrals.
For investors, the discipline is consistent across every disaster event: look past the early insurer headlines. Track who is obligated to fund the physical rebuild, verify what regulators permit utilities to recover from ratepayers, and evaluate the financing terms that dictate forward returns.
Source Verification & Institutional Data Notes
-
Hawaiian Electric Industries: Form 8-K Current Report (Filed 4 September 2026; period ending 8 September 2026) regarding storms Lala/Kona cost accounting and nonrecoverable expense disclosures.
-
Maui Wildfire Settlement Documentation: Hawaiian Electric $4.0B Global Tort Settlement Agreement; Hawaii Supreme Court validation ruling (4 September 2026).
-
Pacific Gas & Electric: Operational Capital Plan & Strategic Review Disclosure (2 September 2026).
-
Catastrophe Modeling & Loss Tracking: Cotality Preliminary Insured Loss Assessment (10 September 2026); PCS Catastrophe Event Designation Report.
-
Reinsurance Industry Metrics: AM Best Mid-Year Reinsurance Market Review (Record H1 2026 ILS Issuance); Artemis Catastrophe Bond & Insurance-Linked Securities Deal Directory (Per-occurrence vs. aggregate composition).
-
State Operations: Office of the Governor of Hawaii (Damage estimates for Kauai County, 10 September 2026).
This analysis is published strictly for educational and informational purposes and does not constitute investment, financial, or legal advice. Securities mentioned illustrate documented regulatory and financial reporting mechanisms from public filings.