
BreakoutBulletin | Flow Tape – May 20, 2026
What Moved the Tape?
The dominant setup heading into today's session is straightforward: NVIDIA reports Q1 FY27 results after the close, and the broader market is treating this as a near-term referendum on the AI infrastructure spending cycle.
That's not a characterization – it's what the flow data reflects. Capital has been moving toward mega-cap tech and AI-linked names ahead of the print, while cyclicals and industrials lag. The positioning is event-driven and concentrated, not a broad risk-on shift.
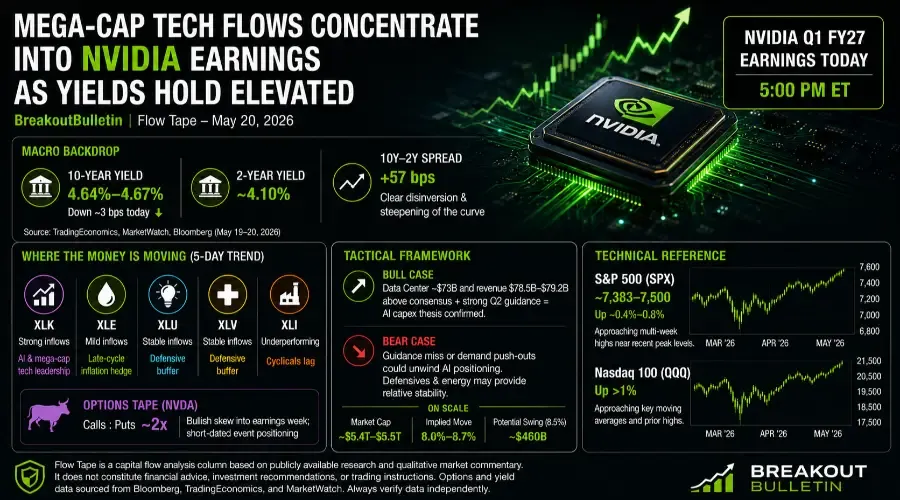
The macro backdrop isn't adding new pressure, but it isn't helping either. Recent U.S. inflation readings are running around the high-3% range. The 10-year Treasury yield is sitting at approximately 4.64–4.67% as of May 19–20, down roughly 3 basis points today after an 8 basis point rise the session prior. The 2-year yield is holding near 4.1%, putting the 10Y–2Y spread at a positive +57 basis points – representing a clear disinversion and steepening of the curve from earlier in the year, though still reflecting a grinding, higher-for-longer structural shift from the Fed.
The yield move today looks like consolidation after the prior session's push higher, not a new macro shock. With no fresh rate catalyst in the last 12 hours, the tape is focused almost entirely on NVIDIA's earnings as the near-term risk event.
Fed cut expectations remain subdued into late 2026. That keeps the rate discount on long-duration growth assets in place – which is the ambient pressure NVIDIA's results and guidance will be tested against tonight.
Source context: 10-year yield data from TradingEconomics; 2-year yield from MarketWatch and Bloomberg US rates. Yield curve characterization based on the spread between these two levels as of May 19–20, 2026.
Where the Money Is Moving
The clearest flow signal over the past five sessions is into XLK and AI-exposed semiconductors ahead of the NVIDIA print.
Technology has been leading index gains, with the Nasdaq 100 rallying over 1% on AI-linked strength in recent days. XLK flows have been trending positively on a five-day basis, consistent with the broader rotation into mega-cap growth ahead of a catalyst of this size.
XLE – Energy – has seen mild inflows and selective rotation interest, which fits the ambient inflation narrative. With yields elevated and inflation sticky, energy has found some support as part of a late-cycle hedge rather than a pure risk-on trade.
XLU – Utilities – and XLV – Health Care – are showing stable to modestly positive interest, reflecting partial defensive positioning that hasn't been fully unwound despite the tech-led risk appetite. Investors appear to be holding both sides of the trade: leaning into AI growth while keeping a partial defensive buffer in place. That combination – tech exposure alongside defensive hedges – is more consistent with tactical event positioning than genuine risk-on confidence.
XLI – Industrials – and broader cyclicals are underperforming. Flows haven't extended into the parts of the market that would benefit from a genuine economic acceleration narrative. That gap between tech strength and cyclical weakness is worth keeping in mind when reading the broader tape.
One important caveat on flow data: Precise dollar flow figures for individual sector ETFs were not available from public sources in this research window. The directional characterization above reflects qualitative flow commentary and five-day trend data. Where exact figures aren't confirmed, they're described as directional rather than precise.
In options, NVDA call volume has been running at roughly 2x put volume heading into the earnings week, reflecting a bullish skew in near-term positioning. Short-dated contracts have been the primary vehicle – effectively functioning as leveraged event plays on the earnings outcome. For broader index options (SPX, QQQ), no specific 12-hour anomaly is clearly documented in public data; the positioning signal here is NVIDIA-specific rather than index-wide.
Source context: Options skew and volume characterization from Bloomberg and options specialist commentary ahead of the May 20 earnings event. Sector flow direction from ETF rotation commentary and five-day performance data.
Tactical Framework Traders May Monitor
This section describes conditional structures – not instructions. Nothing here constitutes a recommendation.
Conditional framework: If NVIDIA's Data Center revenue and Q2 guidance come in above the current consensus range – approximately $73B on Data Center and $78.5B–$79.2B on total revenue – the AI capex thesis gets near-term confirmation. In that scenario, traders may monitor whether XLK and SMH extend their recent strength, and whether the broader Nasdaq follows or lags due to ongoing yield sensitivity.
Confirmation signal: Sustained positive price action across the broader semiconductor complex – AMD, AVGO, TSM – in the session following NVIDIA's report, not just NVDA itself, may indicate the positive read-through is genuine rather than isolated to a single name.
Invalidation scenario: If NVIDIA's guidance disappoints or management introduces language around order push-outs, demand digestion, or Blackwell ramp delays, the current concentrated positioning could unwind across the AI-linked complex. In that case, the selective risk-on rotation supporting XLK may stall, and the defensive and energy positions already held by some investors could provide relative stability by comparison.
On scale: NVIDIA's market cap is currently hovering in the $5.4T–$5.5T range. The options-implied move for tonight's print is priced at approximately 8.0%–8.7% in either direction. At that market cap, an 8.5% move translates to a potential single-session value swing of roughly $460 billion – which makes this one of the largest dollar-value earnings events in market history, regardless of direction. The positioning ahead of a move of that potential magnitude tends to resolve quickly once the numbers are out.
Structural Context
The current flow picture is tactical and event-driven, not structural.
Capital moving into XLK and AI names ahead of a single earnings event reflects short-term positioning around a binary catalyst, not a wholesale re-rating of the growth sector. High Treasury yields and late-cycle concerns haven't gone away – they're being set aside temporarily while the market waits for NVIDIA's demand signal.
The partial defensive positioning that remains in XLU and XLV supports that read. Investors aren't fully abandoning hedges. They're leaning into the AI trade while keeping some cover in place – which is consistent with tactical event positioning rather than a confident structural rotation into growth.
Once the NVIDIA result is out, the flow picture may shift depending on what the guidance signal says about the broader AI infrastructure cycle. A clean beat with strong forward guidance could extend the current XLK-led positioning into the following sessions. A guidance miss or softer demand characterization could trigger a reassessment – not just of NVDA, but of the AI capex narrative that's been supporting the entire growth complex.
Whether this week's positioning becomes structural depends on what tonight's report says about the forward demand picture. The Q1 results matter, but the Q2 guidance range and management's characterization of Blackwell demand are likely to carry more weight for how the tape behaves in the sessions that follow.
Technical Reference
S&P 500 (SPX)
The cash index is trading near approximately 7,383–7,500, up roughly 0.4–0.8% in recent sessions on tech-led strength. Recent commentary describes the index approaching multi-week highs near recent peak levels.
Nasdaq 100 (QQQ)
Has rallied over 1% in recent days on AI-name strength, with commentary describing the index approaching key moving averages and prior highs.
Note on technical levels: Precise support and resistance levels for both SPX and QQQ were not independently validated from confirmed chart data in this research window. The directional characterization above is based on available commentary rather than pinned technical levels. Traders should reference their own charting tools for specific support, resistance, and moving average levels before incorporating them into any decision framework.
Disclaimer
Flow Tape is a capital flow analysis column based on publicly available research and qualitative market commentary. It does not constitute financial advice, investment recommendations, or trading instructions. Flow characterizations reflect available data and directional trends as of May 20, 2026; precise dollar figures were not fully available from public sources in this research window and are noted as qualitative where applicable. Options and yield data sourced from Bloomberg, TradingEconomics, and MarketWatch. Always verify data independently before incorporating it into any trading decision.