
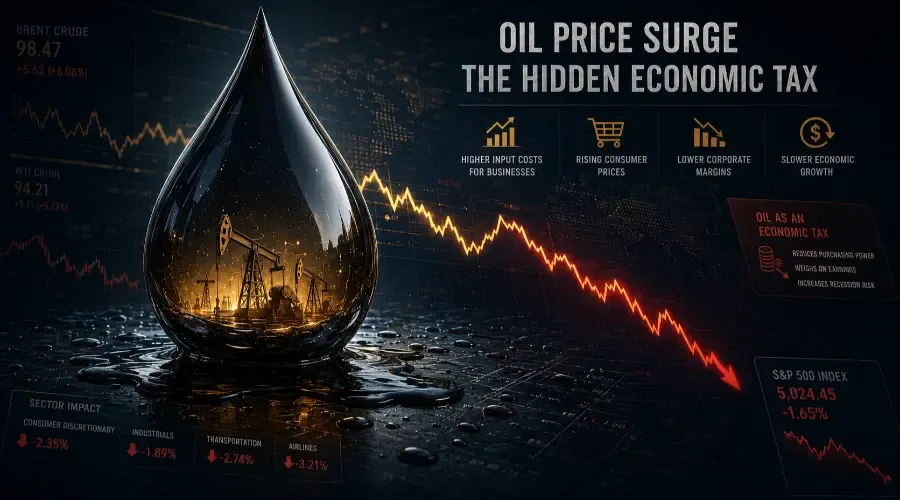
When OPEC+ removes supply from global crude markets, Energy (XLE) is the structural beneficiary – and every other sector faces headwinds through the inflation channel. The US Energy Information Administration tracks OPEC production quotas and actual output, documenting the compliance gap that determines whether announced cuts become real supply reductions. The IMF's analysis of OPEC's rebalancing act examined how cartel decisions interact with US shale and global demand. The most important insight no source clearly states: an oil price rally from an OPEC+ supply cut is fundamentally different from a rally driven by economic demand – and confusing the two produces the wrong sector rotation for every sector except XLE.
Supply Cut vs. Demand-Driven Rally: The Critical Distinction
When oil rises because global growth is accelerating – the 2004–2007 commodity supercycle – almost every sector benefits. Rising oil reflects a growing economy generating higher revenues across manufacturing, transportation, and consumer spending.
When oil rises because OPEC+ has deliberately restricted supply, the economic effect is the opposite. Supply-cut oil inflation is a contractionary tax on every business and consumer that uses energy – raising input costs, compressing margins, reducing disposable income, and forcing the Federal Reserve to maintain tighter monetary policy than growth conditions alone would require. Buy XLE. Simultaneously reduce the rate-sensitive and consumer-exposed sectors that pay the inflation tax.
All sector performance ranges in this post are illustrative historical magnitudes. Each OPEC+ episode occurs in a different macro context – the 2016, 2020, and 2022 cuts each produced materially different outcomes based on starting oil price, monetary policy stance, and concurrent demand conditions.
Trade Execution Matrix
| Phase of Shock | Operational Metric to Monitor | Core Sector Allocation | Tactical Action Rule |
|---|---|---|---|
| Immediate Announcement | Quoted cut vs. consensus expectations | Overweight XLE / Underweight XLRE & XLU | Deploy into energy revenues; exit rate-sensitive assets |
| Months 1–3: Cartel Check | EIA Monthly OPEC Compliance Rate | Maintain if compliance ≥70% | Hold XLE; if compliance <70% for 2 months, exit early |
| Months 6–12: Supply Response | Baker Hughes Weekly Rig Count | Begin rotating out of XLE | Exit structurally once rig count rebounds 10%+ from lows |
The OPEC Put: Saudi Arabia's Price Floor
Saudi Arabia functions as OPEC+'s swing producer – the member with the largest spare capacity and the fiscal resources to absorb lower production volumes. Saudi Arabia's fiscal break-even price (the oil price needed to balance the national budget) is approximately $75–85 per barrel, updated annually by the IMF. Check the latest IMF Article IV consultation for Saudi Arabia for the most current estimate – this number shifts with government spending plans and Vision 2030 investments.
When WTI falls below $75 for four or more consecutive weeks and an OPEC+ meeting is scheduled within six weeks, the probability of a cut rises sharply. This creates the "OPEC put" – a known price floor that makes the XLE recovery trade setup predictable before the announcement.
The Compliance Gap: The Number Nobody Tracks
Every OPEC+ cut announcement comes with a stated production reduction. The actual reduction is always smaller – individual member countries have systematic incentives to overproduce while benefiting from other members' compliance. Iraq, UAE, Kazakhstan, and Nigeria have historically been the most consistent quota-exceaders.
Historical compliance has averaged 60–80% of the announced cut in the months following a major reduction. The EIA's Short-Term Energy Outlook (published monthly) and the IEA's Oil Market Report both track actual OPEC+ production versus stated quotas.
Compliance rule: If compliance falls below 70% for two consecutive months, the oil rally from the announcement will partially reverse. Exit XLE overweights before the production data confirms the defection.
The Crack Spread: A Technical Edge
OPEC+ production cuts are historically concentrated in medium and heavy sour crudes, while US shale basins primarily yield light sweet crude. A sharp OPEC+ cut squeezes complex refinery margins (crack spreads) – the cost of heavy crude inputs spikes relative to light sweet barrels, compressing margins for refineries configured to process heavy grades. This provides sophisticated traders with an additional layer: refining-focused equities and options plays on the WTI/Brent spread and NYMEX crack spread futures often outperform simple XLE exposure in heavy-crude-dominated cut cycles.
SPR Releases: The Policy Offset
Coordinated Strategic Petroleum Reserve releases have become a significant third force alongside OPEC+ cuts and US shale. The 2022 US release of 180 million barrels blunted the post-invasion oil spike materially. Monitor Department of Energy announcements alongside OPEC+ meeting calendars – a coordinated SPR release can reduce XLE upside by 30–50%.
Sector Scorecard
Ranges are illustrative based on historical central tendencies. Magnitude depends on cut size, starting oil price, Fed posture, and whether SPR releases or shale response offsets the supply restriction.
Energy (XLE) – Strong Positive – Immediate
The direct and unambiguous beneficiary. US oil producer revenue rises mechanically with the oil price. Compliance tracking and the Baker Hughes rig count determine how long the position holds – not the announcement itself.
Real Estate (XLRE) and Utilities (XLU) – Moderate Negative – 1–3 Months
The inflation-to-Fed channel is the primary headwind. Higher oil prices feed into CPI within four to six weeks, causing the Federal Reserve to maintain higher rates or delay cuts – raising XLRE's discount rate and compressing XLU's yield premium. Important nuance: this channel is strongest when the oil spike occurs in an environment where inflation is already above target and the labour market is tight. In a low-inflation environment, the Fed may look through a transitory energy spike, muting the XLRE/XLU rotation signal.
Consumer Discretionary (XLY) – Moderate Negative – Immediate
Every $0.10 increase in retail gasoline prices reduces US consumer discretionary spending by approximately $14 billion annually (based on EIA and JP Morgan energy economist estimates; actual pass-through varies with refinery utilisation and regional RBOB spreads). When OPEC+ pushes WTI from $70 to $90/barrel, retail gasoline rises approximately $0.50–0.75/gallon within four to six weeks – a direct XLY revenue headwind.
Consumer Staples (XLP) and Industrials (XLI) – Mild Negative – 1–3 Months
Transportation and logistics costs rise with oil. XLP faces input cost inflation before price increases can be implemented. XLI commercial transportation and fuel-intensive manufacturing sub-sectors face margin compression. Defence contracts within XLI are cost-plus structured and insulated.
Materials (XLB) – Mixed
Petrochemical feedstock companies face higher input costs. Gold benefits modestly from inflation expectations. The net XLB signal is approximately neutral – the inflation tailwind for gold partially offsets the input cost headwind for petrochemicals.
Technology (XLK) – Mild Negative – 1–3 Months
Rising data centre energy costs and modest inflation-driven multiple compression. Impact is smaller than XLRE and XLU.
Financials (XLF) – Mild Negative – 1–3 Months
Inflation persistence delays rate cuts, suppressing NIM expansion. Energy-sector lending improvement partly offsets the headwind.
Historical Cases
2016 Vienna Agreement:
First coordinated OPEC+ cut in eight years – 1.8 million barrels/day. Oil recovered from $45 to $65 over six months. XLE outperformed SPY by over 20% in twelve months. Saudi over-compliance offset member defection. Inflation channel was modest because the starting oil price was low enough that even a $20 increase remained at historically moderate levels.
2022–2023:
Saudi Arabia's voluntary 1 million barrel/day cut demonstrated unilateral price floor defence. Baker Hughes rig counts rose within six months, confirming shale response. The 2022 SPR release – 180 million barrels over six months – simultaneously demonstrated how policy offsets can cap the XLE trade ceiling, compressing upside by an estimated 30–50%.
Playbook
Before:
WTI below $75 for 4+ weeks with OPEC+ meeting within 6 weeks = XLE setup forming.
During:
Add XLE on above-consensus cut. Simultaneously reduce XLRE and XLU. Monitor EIA compliance monthly – exit XLE if compliance <70% for two consecutive months.
After:
Baker Hughes rig count +10% from announcement-low = structural exit. Rebuild XLRE and XLU as inflation signal fades.
Bottom Line Checklist
Supply-cut oil rallies are contractionary – buy XLE, reduce XLRE/XLU/XLY simultaneously
Compliance rate ≥70%: hold XLE · <70% for 2 months: exit early
Baker Hughes rig count +10% from lows: structural XLE exit signal
Saudi fiscal break-even ($75–85/bbl) defines the OPEC put price floor – refresh annually via IMF
SPR releases can cap XLE upside by 30–50% – monitor DOE announcements
Fed channel strongest when inflation already above target; may be muted in low-inflation environments
Crack spread opportunity: heavy crude cut cycles compress complex refinery margins independently of XLE
Q&A
Q: Why is an OPEC+ supply cut rally fundamentally different for the S&P 500 than a demand-driven oil rally?
A: A demand-driven oil rally reflects accelerating global growth – surging economic activity drives corporate earnings across industrials, technology, and consumer sectors, easily offsetting higher fuel costs. An OPEC+ supply cut is a contractionary supply shock – it acts as a direct economic tax, spiking input costs for non-energy corporations, destroying discretionary consumer income, and forcing a hawkish Fed policy path to combat cost-push inflation. This makes the supply cut a risk-off event for the broader market, leaving XLE as the sole structural beneficiary.
Q: What is the OPEC Compliance Rate and how should traders use it?
A: The OPEC Compliance Rate – tracked monthly by the EIA – measures the percentage of promised production cuts that member nations actually execute. If aggregate compliance remains above 70%, the price floor holds and long XLE positions are validated. If compliance drops below 70% for two consecutive months, it signals structural cartel defection – uncoordinated supply is quietly hitting global markets – and signals an early exit from XLE overweights ahead of a potential oil price breakdown.
Q: Why does the Baker Hughes rig count serve as the definitive exit signal for an OPEC+ supply cut trade?
A: US shale operates as a price-sensitive swing producer. When OPEC+ restricts supply to force prices higher, it widens profit margins for non-OPEC drillers. Once the Baker Hughes rig count rebounds 10%+ from its post-announcement lows, it confirms that domestic capex is expanding and new supply is activating. This US shale response fills the cartel's supply deficit, erodes OPEC+'s market share, and signals the mathematical conclusion of the tactical XLE trade.
Educational content only. Not investment advice. All sector performance ranges are illustrative historical magnitudes – each OPEC+ episode varies based on cut size, starting oil price, monetary policy stance, and concurrent demand and SPR policy conditions.