
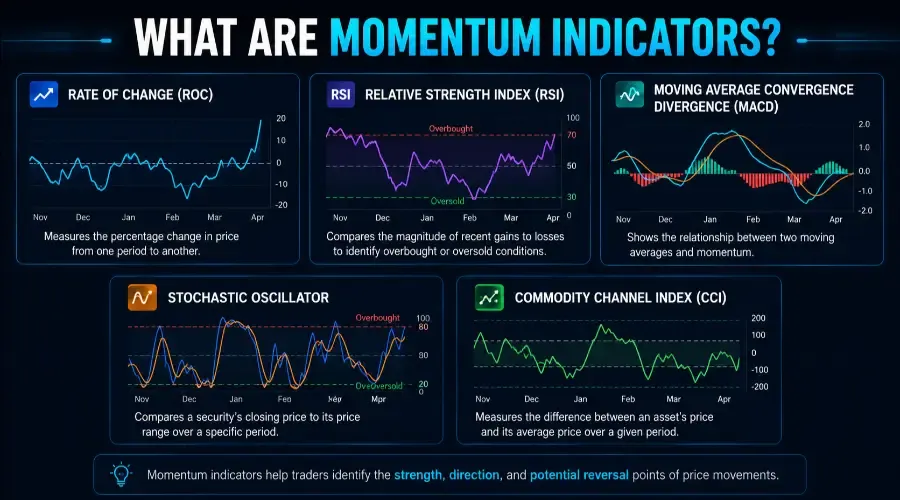
Most retail traders treat momentum indicators like a giant, mechanical text message: "RSI is at 72, time to sell!" or "MACD crossover achieved, hit the buy button!"
If it were that simple, every basic algorithmic bot would be printing money. The truth is that oscillators don't provide immediate trading triggers. They measure price velocity and trend health within a structural window. When you ask a Large Language Model (LLM) to evaluate technical charts without giving it a structural frame, it falls back on the exact same generic textbook definitions that often lose money in live markets.
By using strategic prompt engineering for traders, you can teach your AI assistant to evaluate indicators through the lens of trading indicators context. This transforms a non-predictive mathematical output into an objective, data-driven framework.
Momentum indicator interpretation is one of the five technical analysis tasks covered in this hub. Technical Analysis with AI gives the overview and explains how AI's role as a context-builder applies across all of them.
The indicator readings discussed in this post need to be formatted correctly alongside your price data to produce useful AI output. What to Paste into AI for Chart Analysis covers exactly how to structure that input, including the OHLCV table format and indicator labelling that gives the model what it needs.
The Core Realities of Momentum Indicators
Before prompting an AI to review your chart setup, you must establish the baseline logic the model should operate under. If you feed an AI raw indicator data without constraints, it will confidently hallucinate an immediate reversal.
When configuring your stock chart analysis AI workflows, enforce the following baseline realities:
| Indicator Factor | Common Misconception | Structural Reality (Enforced for AI) |
|---|---|---|
| RSI Overbought (>70) | Immediate short/sell signal. | Price has moved quickly in a short window. In strong macro trends, RSI can sit overbought for weeks. |
| MACD Crossover | Leading predictive entry trigger. | Lagging confirmation mechanism derived from moving averages. It confirms a trend already in motion. |
| Divergence | Instant timing tool for reversals. | A structural condition, not an immediate trigger. Divergence can persist across many sessions before a shift materializes. |
Setting the Rules for Timeframe and Context
Two major pitfalls trap traders when using AI for indicator synthesis: timeframe mixing and context over-allocation.
The Timeframe Alignment Rule
Traders frequently mistake a multi-timeframe mismatch for a high-probability conflict. Comparing a Daily RSI showing a strong overbought trend with a 1-hour MACD showing a minor bearish crossover leads to total analytical noise. Your inputs must strictly align across the same timeframe to maximize the accuracy of your RSI MACD trading strategy evaluation.
Guarding Against Context Overfit
While modern LLMs process extensive information, dumping unorganized global macro news, unrelated earnings rumors, and loose chat room sentiment into your prompt dilutes the model's focus. Stick strictly to structural context that directly affects how the current indicator's setup should be interpreted–such as nearby major support/resistance levels, volume profile shifts, and the overall market regime.
Technical Note on AI Attention
Large Language Models do not "hold" or internalize context the way a human brain does. They generate responses based on mathematical token probability and attention weights. Because of this, an LLM can occasionally drop a crucial variable or weigh conflicting signals arbitrarily. Treat the AI as an elite analytical compiler. It's excellent at processing structured data, but its final synthesis must always be cross-checked manually before executing live risk.
The Master Prompt for Multi-Indicator Synthesis
When your charts show conflicting patterns–like an index grinding higher on a daily chart while momentum indicators display clear divergence–you need a prompt layout that forces the AI to systematically evaluate the tension.
You don't want a non-committal response. You want it to process the structural conflict. This layout works cleanly across all leading models when pasting your TradingView AI prompts.
The Strategic Alignment & Conflict Prompt
text
System Role: You are a structural market analyst specializing in momentum oscillators and trend regimes. Your task is to analyze the structural tension between current price action and indicator levels.
Execution Framework:
- Asset & Aligned Timeframe: [Insert Ticker, e.g., SPY] on the [Insert Timeframe, e.g., Daily Chart]. Do not blend data or indicators from other timeframes.
- Market Regime Context: Price is currently trading [above/below/at] the [e.g., 50-day EMA], within a macro [bullish trend/bearish trend/range-bound consolidation].
- Core Technical Inputs:
- Current Price Action: [e.g., Made a new 52-week high at $515]
- RSI (14) Value: [e.g., 72]
- MACD (12, 26, 9) State: [e.g., MACD line is above signal line, but the MACD Histogram peak is visibly lower than the peak formed during the previous price high]
Analysis Constraints & Objectives:
- Treat the MACD divergence as a structural condition, not an immediate timing or execution trigger. Acknowledge that this divergence can persist across many sessions before a reversal materializes.
- Filter out all unrelated external market news; evaluate only the immediate structural context provided.
- Assess which signal carries more structural weight in this specific regime. Critical note: Base this on mathematical trends and rules, as your output must be verified manually before any final decision is made.
Fallback Directive:
If the provided technical inputs do not clearly favor one directional outcome over the other, explicitly state that the conflict is unresolved. Do not manufacture an arbitrary directional bias or provide a non-committal compromise. Instead, list the exact structural price levels or indicator shifts to monitor to confirm which side breaks the deadlock.
Conflicting momentum signals are often resolved by the price structure context, where price sits relative to key levels and what pattern may be forming. How to Identify Support, Resistance, and Chart Patterns Using AI covers how to add that structural layer to a momentum indicator prompt.
Technical Analysis AI: Q&A Section
Q: Can I paste chart screenshots directly into an AI for momentum indicator analysis?
A: While vision models can detect basic visual trends, they cannot reliably read exact historical indicator values, subtle histogram contractions, or the precise session where a line crossover occurred. Translating these chart values into structured text data prevents the tool from hallucinating critical technical values.
Q: How do I handle it if the AI gives a completely generic textbook response?
A: This typically happens when the prompt lacks strict boundaries. Re-prompt the model using a negative constraint: "Analyze the data provided using only the parameters in my prompt. Do not provide basic, generic dictionary definitions of RSI or MACD."
Q: Why does the prompt instruction explicitly require treating divergence as a condition rather than a trigger?
A: Bearish or bullish divergences can stretch across multiple weeks or sessions during aggressive market extensions. Forcing the AI to look at divergence as an environmental state prevents it from jumping to premature trend reversal conclusions.
Q: Can I mix inputs from different technical indicator families?
A: Yes. In fact, combining a momentum oscillator (like RSI) with a volume indicator (like Chaikin Money Flow or Volume Relative Strength) and trend indicators (like moving averages) creates a highly robust data layer that allows the AI to deliver superior contextual synthesis.
Using these frameworks, you can turn generic AI indicator analysis into a precise, structural evaluation of trend health and momentum context. The key is consistent formatting and explicit timeframe alignment–the same principles covered in our AI Chart Analysis Input Templates guide. With practice, you'll get AI to flag when divergence is simply a warning flag rather than a reason to exit prematurely, which is exactly what a disciplined trader needs.
How to Put This Into Practice
When you run this framework through your workflow, look specifically for how the model frames the coexistence of the signals. A high-quality response will not tell you to "buy" or "sell." It will output a structural synthesis:
"While the asset continues to display structural strength by maintaining its position above the 50-day EMA, the lower peak on the MACD histogram establishes a clear regime condition of slowing upward velocity. Because divergence is an environmental risk state rather than a timing trigger, the trend remains intact until structural support at [Level] is cleanly broken. Watch for an RSI break below 60 to confirm momentum shifting out of the buyers' hands."
By shifting your prompting style from "what happens next?" to "how do these conflicting forces interact within this specific timeframe?", you align your AI technical analysis routine directly with the true nature of professional risk management.