
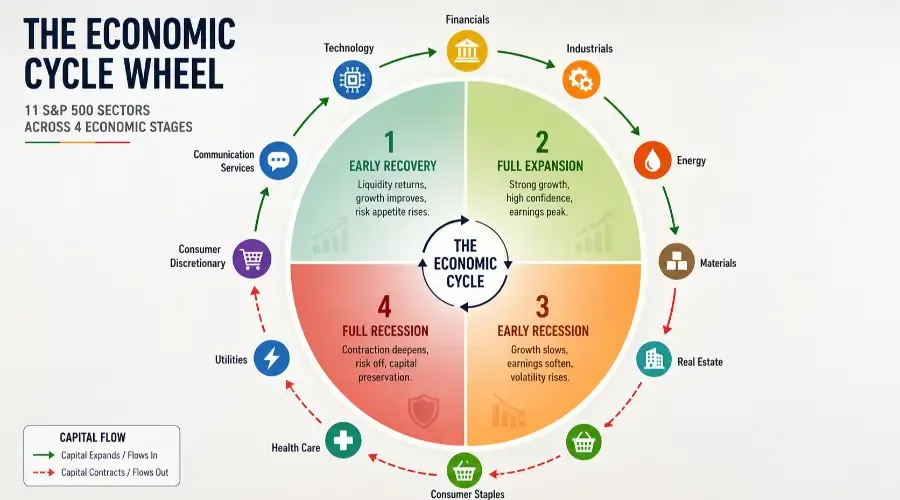
When a market correction begins, novice traders often panic and liquidate their entire portfolios to cash. Professional money managers, however, rarely exit the market completely. Instead, they reallocate capital.
This process is known as Sector Rotation–the systematic migration of capital out of weakening industries and into sectors showing dominant relative strength.
By mastering sector rotation, you stop trying to fight the broad market tide. Instead, the goal is to identify trends consistent with developing institutional capital shifts. This guide breaks down the underlying mechanics of sector rotation, details the math behind the Weighted Relative Strength (RS) Score, and provides a systematic weekly execution blueprint.
1. The Core Premise: Relative Strength vs. Absolute Price
To outperform the S&P 500 (SPY), you must focus on Relative Strength (RS) rather than absolute price. A stock or sector can be in an absolute downtrend while displaying positive relative strength if it is falling significantly slower than the benchmark index.
During a market correction, money typically flows out of “risk-on” cyclical groups (like Technology or Consumer Discretionary) and hides in “risk-off” defensive groups (like Utilities or Consumer Staples).
Tracking each sector’s ratio line against SPY allows a trader to spot which sectors are outperforming (rising ratio line) or underperforming (falling ratio line) the broader market.
2. The Math Behind the Matrix
To reduce human bias, we quantify relative strength across three distinct timeframes. First, we establish the base relationship ratio (R) for any given sector:
R = Sector Close ÷ Benchmark Close
Next, we calculate the Rate of Change (ROC) of that ratio over a specific number of days (N). This tells us whether the sector’s relative performance is accelerating or decelerating compared to the benchmark:
ROC(N) = ((R today ÷ R N-days ago) − 1) × 100
Finally, we combine these lookback periods into a single, unified metric. The Weighted RS Score allocates specific mathematical weight to each timeframe:
Weighted RS Score = (0.15 × ROC 5d) + (0.35 × ROC 20d) + (0.50 × ROC 60d)
Strategy Breakdown:
-
The 60-Day Weight (50%): By anchoring half of the total score to a rolling 60-day window, the model privileges major structural trends over temporary, short-term market noise.
-
The 20-Day Weight (35%): Captures intermediate-term momentum shifts as they develop across the industry landscape.
-
The 5-Day Weight (15%): Serves as an early warning system. While it cannot override the dominant 60-day trend on its own, a sharp move in the 5-day score provides immediate notice of nascent market pivots.
A Worked Example:
To see how this math functions in the real world, let’s look at a hypothetical calculation for the Technology sector (XLK) when outperforming the benchmark:
-
Short-Term Momentum: 5-Day ROC shows a relative gain of +1.80% (1.80 × 0.15 = 0.27)
-
Intermediate-Term Momentum: 20-Day ROC shows a relative gain of +3.20% (3.20 × 0.35 = 1.12)
-
Structural Trend: 60-Day ROC shows a relative gain of +5.50% (5.50 × 0.50 = 2.75)
-
Final Weighted RS Score: 0.27 + 1.12 + 2.75 = +4.14
3. The Sector Categorization Cheat Sheet
When analyzing the matrix rankings, it helps to understand the underlying behavioral personality of each GICS sector.
| Sector Category | Sector ETFs | Market Environment Alignment |
|---|---|---|
| Cyclical (Risk-On) | XLK (Technology)XLY (Consumer Discretionary)XLC (Communication Services)* | Tends to lead during strong, liquidity-driven bull markets and early economic expansions. |
| Sensitive (Gears with Economy) | XLF (Financials)XLI (Industrials)XLB (Materials)XLE (Energy) | Highly tied to GDP growth, inflation dynamics, interest rates, and commodity cycles. |
| Defensive (Risk-Off) | XLV (Health Care)XLP (Consumer Staples)XLU (Utilities)XLRE (Real Estate) | Tends to attract capital inflows during market corrections, rate-cut cycles, and recessions. |
Note on XLC: The Communication Services sector operates as a hybrid asset class. It holds aggressive, mega-cap growth giants alongside traditional, high-dividend defensive telecommunication firms, making it highly dynamic across differing market environments.
4. The Execution Blueprint
To integrate this model into a trading routine, a participant can implement a structured, objective process every weekend when the markets are closed.
Step 1: The Weekly Scan
Run the Weighted RS Score calculations across all 11 GICS sectors every weekend. Rank the results cleanly from 1 (strongest relative strength score) to 11 (weakest relative strength score).
Step 2: Absolute Trend Filtering
Relative strength must always be validated by absolute trend alignment. A standard framework filters the Leading Sectors (Ranks 1–3) by confirming whether they are trading above their respective 50-day Simple Moving Averages (SMA). If a top-ranked sector is below its 50-day SMA, the model indicates that its strength is merely defensive (falling slower than a crashing market) rather than an active expansion trend.
Step 3: Candidate Selection
The strategy focuses capital allocation considerations exclusively on the qualified Leading Sectors (Ranks 1–3). Once the top individual sectors are identified, a trader can drill down into the strongest individual stocks within those specific groups to look for clean technical breakout patterns.
Step 4: Systemic Risk Management & Rotational Exits
Positions are managed closely based on their evolving structural bands:
-
Ranks 1–3 (Leading): Maintain full core long exposure.
-
Ranks 4–7 (Neutral / Buffer Zone): If a held sector drifts into this middle tier, the model signals a hold on existing exposure but pauses new accumulation. Utilizing this neutral band as a buffer zone prevents excessive trading churn from minor weekly ranking fluctuations.
-
Ranks 8–11 (The Laggards): If a sector drops systematically into the Laggard tier, the framework signals that the structural trend has deteriorated, indicating an exit or avoidance of new long positions.
Disclaimer: Breakout Bulletin is an educational platform. All content, tools, and calculators are for informational and educational purposes only and do not constitute financial, investment, or trading advice. Trading stocks and options involves significant risk of loss and is not suitable for every investor. Past performance is not indicative of future results.