
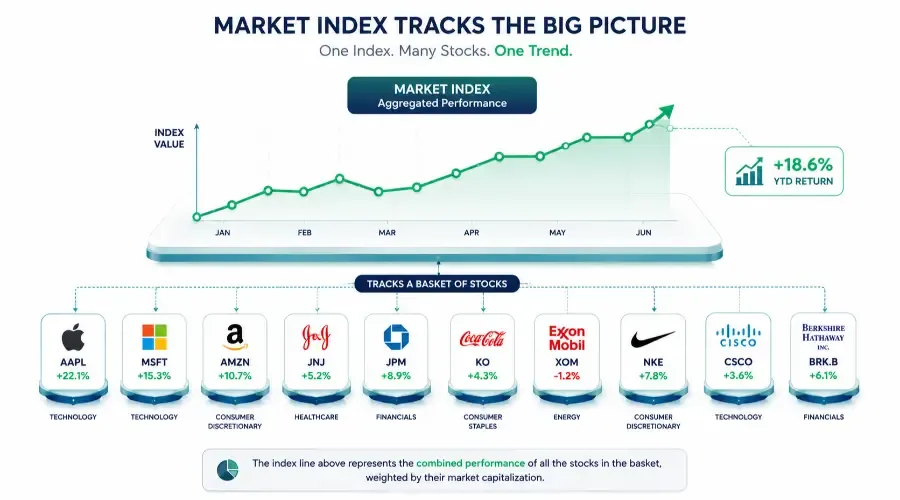
When someone says "the market is up 1.5% today," they're not describing the average movement of every publicly traded company. They're referencing an index – a single number that tracks the performance of a specific group of stocks. Understanding what that number represents changes how you read financial news.
The Basic Idea
A stock market index is a calculated value that tracks the collective price performance of a defined basket of stocks. The index is updated continuously during trading hours as the prices of its component stocks move.
An index doesn't trade itself. You can't buy "the S&P 500" the way you buy a share of Apple. The index is a measuring tool – like a thermometer for a specific segment of the market.
Why Indices Exist
Tracking 500 individual stock prices to assess the market's direction would be impractical. An index collapses that information into a single number that changes in real time, giving investors a quick read on whether the market is broadly rising or falling.
Indices also serve as benchmarks. If your portfolio grew 8% over a year while the S&P 500 grew 14%, that gap is worth understanding – it may suggest the specific stocks you selected underperformed the broader market average.
The Three Indices You'll See Most
S&P 500
The Standard & Poor's 500 tracks 500 of the largest publicly traded U.S. companies, selected by a committee based on size, liquidity, and industry representation. It covers roughly 80% of total U.S. stock market value by capitalization.
When analysts, journalists, and investors refer to "the market," they usually mean the S&P 500. It's weighted by market capitalization, so larger companies like Apple and Microsoft exert more influence on the index's daily movement than smaller constituents.
Dow Jones Industrial Average
The Dow tracks 30 large, established U.S. companies selected by editors at S&P Dow Jones Indices. Founded in 1896, it's the oldest major U.S. index and the one most frequently cited in mainstream media. It's price-weighted rather than market-cap weighted, which means a higher-priced stock moves the index more regardless of the company's actual size – a methodological quirk that makes it less representative than the S&P 500.
The Dow captures roughly 25% of total U.S. market value. Its 30 components are well-known names: Nike, Disney, Coca-Cola, JPMorgan, Apple.
NASDAQ Composite
The NASDAQ Composite includes all 3,000-plus companies listed on the NASDAQ exchange. It's heavily weighted toward technology – Apple, Microsoft, Amazon, Nvidia, and Meta together represent a significant share of the total index value. It's more volatile than the S&P 500 because technology stocks tend to swing more sharply in both directions.
When coverage mentions "tech stocks fell sharply," the NASDAQ is usually the index they're tracking.
Points vs. Percentages
Financial media report index moves in both points and percentages. Points tell you the absolute change in the index's numeric value. Percentages tell you the proportional impact.
A 400-point Dow drop sounds significant. At a Dow level of 42,000, it represents roughly 0.95% – less than 1%. A 400-point drop at a Dow level of 10,000 would be a 4% decline – a meaningfully different situation. Points without context mislead. Always check the percentage.
Using an Index as a Benchmark
The simplest way to use an index: compare your portfolio's return to the relevant index over the same period. If your holdings are mostly technology stocks, the NASDAQ Composite is the natural benchmark. If you hold a broad cross-section of U.S. companies, the S&P 500 applies.
Consistently trailing the S&P 500 by a meaningful margin over several years is information. It doesn't automatically suggest a change in approach, but it's worth understanding whether the gap reflects sector exposure, individual stock selection, or the period's market dynamics.
Investing in an Index
While you can't buy the index directly, index funds and exchange-traded funds (ETFs) hold shares in the same companies and proportions as a given index, tracking its performance closely. A fund tracking the S&P 500 gives you exposure to all 500 constituent companies through a single purchase. More on that in the S&P 500 deep dive.
This content is for educational purposes only and does not constitute investment, legal, or tax advice. Investing in securities involves risk, including possible loss of principal. Always conduct your own research and consult a licensed financial professional before making investment decisions.
Indices are the measuring tool - but the real value is in understanding what each one actually measures and which one is the right benchmark for what you own.
→ Stock Market Indices Explained → S&P 500, Dow Jones, and NASDAQ compared in full - www.breakoutbulletin.com/article/how-stock-markets-function-exchanges-liquidity
→ The S&P 500 Deep Dive → The index, the ETFs that track it, and the SPIVA data on active vs. passive - www.breakoutbulletin.com/article/sp-500-for-teens-guide
→ Dow Jones Industrial Average Explained → Why the points number misleads and the percentage is what matters - www.breakoutbulletin.com/article/dow-jones-explained-for-teens