
Most traders who blow up their accounts don't do it because their strategy stopped working. They do it because their risk management stopped working while their strategy was fine.
The sequence is consistent: correct directional thesis, oversized position, stop placed by feel rather than calculation, trade goes against them more than expected, and the loss takes three winning trades to recover. Not bad analysis. Bad sizing and inconsistent stop discipline – applied to trades where the analysis was actually sound.
AI doesn't fix this by improving your analysis. It fixes it by creating an accountability structure your psychology can't override. A mechanical calculation is harder to rationalise around than a judgment call made under pressure.
Risk management is the second of six strategy-specific applications in the Strategy-Specific Applications with AI hub. It gives the full overview and explains why AI is most valuable when it works within your strategy's rules rather than around them.
Why Traders Don't Apply Their Own Rules
Three failure modes account for most risk management breakdowns:
Conviction override – the setup looks exceptional, so 2% becomes 3% or 4%. When it works, the deviation gets reinforced. When it doesn't, the loss exceeds what the framework was designed to absorb.
Loss recovery acceleration – after a drawdown, the instinct is to recover faster. The next trade goes on oversized while the trader is simultaneously managing an emotional deficit and an oversized position.
Gradual drift – 2% becomes 2.2%, then 2.5%, then 3% across a winning streak. Imperceptible session by session. Visible only in the weekly review. By the time a difficult week arrives, positions are meaningfully larger than intended.
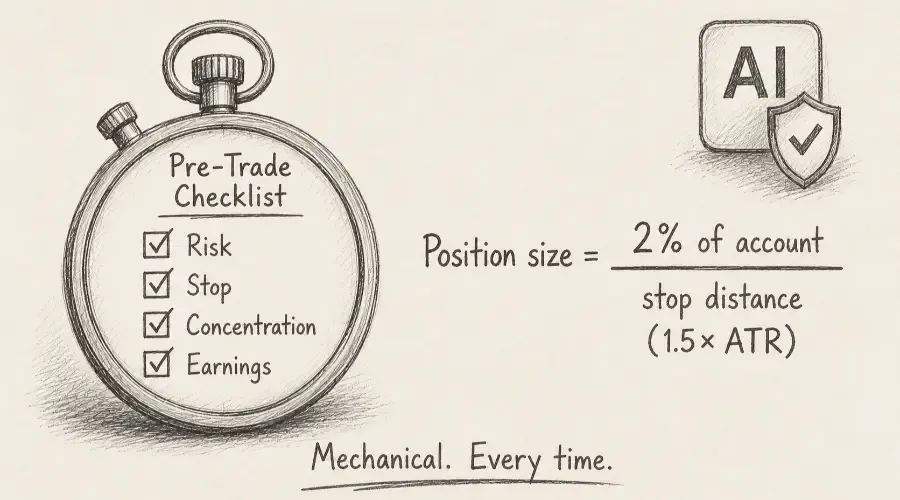
AI addresses all three by making the risk calculation mechanical and the pre-trade compliance check systematic. The calculation doesn't flex for conviction. The checklist runs regardless of prior performance.
The Position Sizing Framework
Three components form the complete position sizing rules:
Account-based risk limit – maximum percentage of account at risk per trade. The standard is 1–2%. At 2%, fifty consecutive losses would be required to lose the entire account. At 5%, ten consecutive losses produce a 50% drawdown requiring a 100% return to exit.
Stop-distance-based sizing – position size is derived from dollar risk and distance to stop. $1,000 risk on a $7 stop = 142 shares. Conviction level plays no role in the calculation.
ATR-based stop placement – stops at 1.5x–2x the 14-period ATR reflect actual volatility rather than psychological comfort. A volatile stock's wider ATR automatically reduces position size. A less volatile stock's tighter ATR allows a larger position for the same dollar risk.
Note: the framework assumes hard stops at specific price levels. Traders using mental stops or scaled exits should adapt the arithmetic accordingly. Some experienced traders also reduce risk per trade during high-volatility regimes – cutting from 2% to 0.5–1% when market conditions deteriorate – as a refinement to the baseline framework.
The Position Sizing Prompt
Calculate position size using a 2% risk rule.

Account: $[amount] | Entry: $[price] | Stop: $[price]
14-period ATR: $[value] – verify this is current before pasting;
ATR changes each session.

(1) Maximum dollar risk at 2%.
(2) Stop distance in dollars.
(3) Position size: dollar risk ÷ stop distance.
(4) ATR validation: where does a 1.5x and 2x ATR stop sit?
    Is my stated stop within that range?
(5) Total position value at calculated share count.
(6) If rounding to round lots is required, state revised dollar risk.

Show each calculation step. Always verify arithmetic independently
before executing – AI can make calculation errors.
The ATR validation in step (4) is the critical output. A stop inside the stock's normal volatility range will be triggered by noise rather than a genuine setup failure. If your stated stop is tighter than 1.5x ATR, either widen it or accept the higher probability of a noise-based exit.
Beta data for scenario analysis: Yahoo Finance (Statistics tab) and Finviz both display beta. Morningstar provides longer-period figures where recent volatility may distort shorter-period calculations.
Portfolio Concentration Check
Individual trade risk prevents any single trade from becoming catastrophic. Portfolio-level risk management prevents individually reasonable trades from becoming catastrophically correlated.
Six positions in semiconductor stocks with 2% individual sizing produces six independent risks during normal conditions and one large correlated risk during a sector-specific shock. The 2% rule provides no protection against that aggregate.
Maximum 30–35% in any one sector is the concentration threshold. Beyond this, sectors move together during stress events in ways that normal-market correlations underestimate.
Cross-sector correlation matters too. Technology and communication services frequently move together during rate-driven selloffs. A combined 50% across two correlated sectors may carry the effective concentration risk of a single large position. Build the check to flag this, not just single-sector exposure.
Act as a risk manager reviewing my portfolio before adding a new position.

Current positions: [ticker, sector, dollar value, % of account]
Account value: $[amount]
Proposed position: [ticker], [sector], [shares] at $[entry] = $[value]
= [%] of account.

(1) Current sector exposure as % of account for each sector.
(2) Combined sector exposure after adding the proposed position.
(3) Flag any sector exceeding 30% of account after addition.
(4) Flag any cross-sector correlation risk – note sectors that
    historically move together during stress.
(5) GO if no threshold breached. NO-GO with specific breach identified.
Pre-Trade Checklist
Act as a risk manager running a pre-trade compliance check.

Trade: [ticker] | [Long/Short] | Entry: $[price] | Stop: $[price]
Size: [shares] | Target: $[price] | Sector: [sector]
Earnings date: [date or "not within 5 days"]
Current sector exposure in [sector]: [%]
Open positions: [summary]

Risk rules:
– Max 2% risk per trade = $[dollar amount] on $[account]
– Stop within 1.5x–2x 14-period ATR (ATR = $[value])
– Max 30% sector concentration
– No entries within 5 days of earnings

State PASS or FAIL for each:
(1) Dollar risk vs 2% limit
(2) Stop vs ATR range
(3) Risk/reward – minimum 2:1
(4) Sector concentration after adding position
(5) Earnings exclusion compliance

Overall: GO if all pass. NO-GO if any fail – name the specific condition.
The binary GO/NO-GO removes the ambiguity that allows rationalisation. A failed condition produces a NO-GO – not a "mostly passes" verdict the trader can interpret as permission.
The pre-trade compliance check catches individual trade violations. The weekly review catches the aggregate patterns, position sizing drift, concentration creep, the inconsistencies that compound gradually. How to Use AI for End-of-Week Portfolio Review covers the weekly risk review process that closes the loop.
A risk framework is most robust when the strategy it's protecting has been tested for structural soundness first. How to Backtest a Strategy Idea Using AI covers the logic testing process that validates the strategy, so the risk rules you build here are protecting something with genuine edge rather than a design flaw.
AMD Walkthrough
Setup: $50,000 account. AMD long at $175, stop at $168, ATR $6.40, target $189.
Position sizing:
- Dollar risk: $1,000
- Stop distance: $7.00 → 142 shares initial
- ATR check: 1.5x ATR = $9.60 → stop should be at $165.40. The stated stop at $168 is tighter than 1.5x ATR – inside AMD's normal volatility range
- Corrected: widen stop to $165.40, revised size = $1,000 ÷ $9.60 = 104 shares, rounded to 100 shares at $17,500 total
Concentration check: trader holds 20 shares NVDA at $875 = $17,500 = 35% of account in semiconductors. Adding 100 AMD shares at $175 = $17,500 brings combined semiconductor exposure to $35,000 = 70% of account – more than double the 30–35% threshold.
Result: AMD passes individual sizing criteria after the stop is widened but fails the portfolio concentration check. The NVDA position must be reduced before AMD can be added – or AMD cannot be entered until semiconductor exposure is brought within limits.
The model identifies the breach. The decision is the trader's. But it is now a conscious choice made with full awareness of the concentration problem – not an oversight discovered after the fact.
Frequently Asked Questions
Q: Why do most traders with solid strategies still struggle with risk management?
The issue is execution, not analysis. Conviction override, loss recovery acceleration, and gradual drift cause traders to bypass their own rules at precisely the moments when discipline matters most. Using AI as an objective compliance check forces adherence to mechanical calculations regardless of emotional state. The framework doesn't flex for conviction level or recent performance – that consistency is the protection.
Q: What is the benefit of an ATR-based stop over a psychological stop?
A psychological stop ignores actual volatility. A stock with a $6.40 ATR moves approximately $6.40 on an average day – a $5 stop gets triggered by normal price action rather than a genuine breakdown. An ATR-based stop at 1.5x–2x the 14-period ATR places the exit at a level that distinguishes noise from structural failure. Position size then follows from the stop distance, keeping dollar risk consistent across different stocks and volatility profiles.
Q: How does portfolio concentration risk differ from individual trade risk?
Individual risk management – the 2% rule – protects against any single trade becoming catastrophic. Concentration risk is a separate problem. Even with perfect individual sizing, holding 70% of an account in semiconductor stocks creates a single correlated bet. A sector-specific catalyst hits all positions simultaneously. Six independent 2% risks in one sector become a correlated exposure that the position sizing framework was never designed to contain. The concentration check is the second layer of protection that sizing alone cannot provide.