
BREAKOUTBULLETIN · COMMODITIES / SECOND-ORDER SIGNAL
By Manish T. · August 11, 2026 · 9 min read
Everyone watches USDA supply-and-demand tables. Far fewer investors watch whether the grain is actually moving.
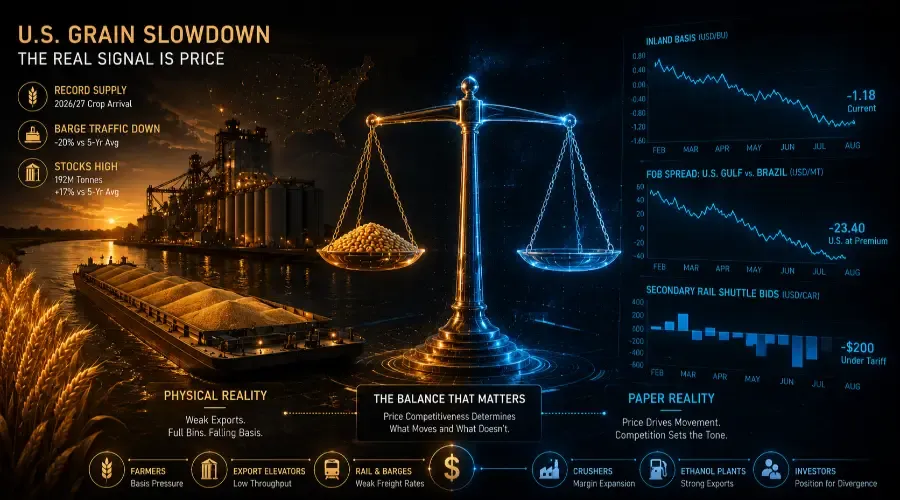
The weekly transportation data unshipped balances, downbound barge loadings, rail shuttle bids, and Gulf vessel counts can reveal export demand and execution problems weeks before the monthly WASDE balance sheet fully reflects them.
However, this is not a simple story of logistics breaking down. The root cause of weak physical movement is price uncompetitiveness, not transport friction. That distinction changes how the trade is expressed across grain futures, basis markets, and agribusiness equities.
                    [ Record 2026/27 Crop Arrival ]
                                   │
                  ┌────────────────┴────────────────┐
                  ▼                                 ▼
    [ High US FOB vs. South America ]     [ Domestic Processing ]
                  │                                 │
                  ▼                                 ▼
     [ Export Sales & Shipments Fall ]     [ Cheap Inland Feedstock ]
                  │                                 │
                  ▼                                 ▼
     [ Secondary Rail / Barge Bids Drop ]  [ Record Ethanol & Meal Exports ]
                  │                                 │
                  ▼                                 ▼
     [ Inland Basis Collapses ]            [ Crush & Ethanol Margins Expand ]
                                           (ADM, Bunge, Green Plains)
1. What the Logistics & Freight Data Shows
The figures below combine USDA reports, Corps of Engineers barge counts, and trade-desk freight data, benchmarked against five-year seasonal averages.
| Indicator | Latest Reading | Seasonal Context | Primary Driver |
|---|---|---|---|
| U.S. Grain Stocks (June 1, 2026) | 192 million tonnes | +17% vs. 5-year average (highest since 2020) | Multi-year inland accumulation |
| 2026/27 Soybean Production | 121.8 million tonnes | Record harvest estimate (July WASDE) | Favorable growing conditions |
| 2026/27 Corn Production | 406.0 million tonnes | Near-record harvest estimate (July WASDE) | Large acreage & high yields |
| Unshipped Export Balances | Low-teens million tonnes | Still above year-ago levels | Weak new sales failing to replace shipments |
| Downbound Grain Barge Counts | -20% or lower vs. 5-year avg. | Matched against week-specific summer baseline | Weak Gulf export pull |
| New Orleans Grain Unloads | -18% vs. 5-year average | Multi-year seasonal lows | Lack of ocean vessel line-ups |
| Secondary Shuttle Railcar Bids | -$100 to -$300 / car under tariff | Down sharply vs. positive spring premiums | Low demand for rail-to-port capacity |
| CIF NOLA Basis Spreads | Weakening relative to interior | Below historical harvest entry spreads | Export elevators avoiding over-coverage |
2. The Unshipped-Balance Signal Needs Care
A falling unshipped export balance is not automatically bullish or bearish on its own. Unshipped balances draw down for three distinct reasons:
-
Shipments outpace new sales (Neutral to bullish if export pace is strong).
-
New sales are missing (Bearish - the export book is simply running dry).
-
Sales are being cancelled or rolled to next crop year (Strongly bearish).
To interpret the signal correctly, investors must track the ratio of new sales to weekly shipments.
Recent USDA data reveals a clear pattern: weekly net soybean sales have dropped as low as ~50,000 tonnes in recent weeks, while corn sales continue to miss seasonal benchmarks. The drawdown in unshipped balances is not a sign of healthy export execution; it indicates the industry is working off an old book without rebuilding new-crop demand.
3. The Root Cause: FOB Price Competitiveness
The primary driver behind weak movement is not river congestion or equipment shortages, it is origin pricing.
In recent weeks, U.S. Gulf corn and soybean FOB values have traded at a persistent premium to South American offers. Brazilian FOB prices (Paranaguá/Santos) and Argentine offers have consistently undercut U.S. Gulf and Pacific Northwest (PNW) quotes for late-summer and early-autumn delivery.
FOB Export Price = Inland Farm-Gate Price + Interior Freight + Port Elevator Margin
When South America holds a price advantage, international buyers shift purchasing windows. A transport slowdown caused by temporary river low-water or lock delays creates pent-up demand that rebounds once logistics clear. A slowdown caused by uncompetitive FOB pricing leaves grain stranded inland, forcing local basis to collapse until flat prices drop enough to restore export competitiveness.
This is a classic example of why commodity investors should look beyond the headline price and examine the physical-market plumbing underneath it. Freight availability, inventories, processing capacity, basis and regional price spreads can reveal whether a commodity market is genuinely tightening or simply experiencing a temporary disruption in movement.
4. Corridor Divergence: Gulf Barges vs. PNW Rail Shuttles
The slowdown is not felt uniformly across all export routes. The U.S. grain export machine operates through two primary arteries:
The Gulf Corridor (Mississippi River System)
-
Mechanics: Relies on river barges moving downbound to New Orleans export elevators.
-
Current Status: Downbound barge counts down >20% versus five-year averages. With European, North African, and Middle Eastern buyers sourcing cheaper South American or Black Sea grain, Gulf export elevators lack the pull to bid up river freight.
The PNW Corridor (Pacific Northwest Rail System)
-
Mechanics: Relies on 110-car unit trains ("shuttles") running from the Northern Plains to Washington and Oregon ports, primarily serving Asian destinations.
-
Current Status: Secondary railcar freight markets—where grain elevators trade shuttle car capacity—have seen bids fall below tariff rates (-$100 to -$300 per car). Asian buyers, particularly in China, are delaying purchasing commitments or opting for Brazilian shipments, leaving rail capacity underutilized.
This secondary railcar weakness confirms that the slowdown is not isolated to river logistics; it spans both major ocean export corridors.
5. Seasonality Baseline Matters
Barge traffic and rail movements are inherently seasonal. Late July and early August represent a natural low point in the U.S. grain marketing year as old-crop stocks drain and harvest has yet to begin in earnest.
-
Incorrect Baseline: Comparing late-July barge counts to spring planting or autumn harvest peaks will always generate a false crash signal.
-
Correct Baseline: Comparing late-July barge counts to the five-year average for the exact same week.
Even when benchmarked against the five-year seasonal average for late July, downbound barge traffic and Gulf unloads show a double-digit deficit. The system is operating below its normal seasonal baseline.
6. The Harvest Setup & The Domestic Processing Cushion
As the 2026 harvest approaches, massive new supply is arriving into an inland market already holding multi-year high stocks:
Record Harvest + Weak Export Pull = Severe Inland Grain Storage Pressure
If export channels do not clear this volume, grain does not disappear - it accumulates at country elevators and farm storage. This creates two distinct market dynamics:
1. Export Elevators & Farmers Face Basis Pressure
Inland country elevators in surplus regions (e.g., Western Corn Belt) are forced to widen interior basis levels to discourage delivery, transferring financial risk back to the farm gate.
2. Domestic Processors Benefit from a Cheap Feedstock Cushion
While export infrastructure suffers, domestic processors, specifically soybean crushers and fuel ethanol producers enjoy an expanding margin environment.
Unlike raw grain exports, domestic processing is supported by strong co-product demand:
-
Soybean Meal Export Strength: Global demand for protein feed has kept domestic soybean crush margins resilient.
-
Fuel Ethanol Export Surges: U.S. ethanol exports have hit multi-year highs, absorbing excess corn supply and supporting processing returns.
Domestic processors like Archer-Daniels-Midland (ADM), Bunge (BG), and Green Plains (GPRE) benefit from cheap, captive inland feedstock, allowing them to capture wide processing spreads even as raw grain export channels stagnate.
7. Supply Chain Matrix: Winners, Losers & Expressions
| Market Segment | Entity / Metric | Primary Impact | Exposure Mechanism |
|---|---|---|---|
| Domestic Processors | ADM, Bunge, Green Plains | Bullish (Margin Expansion) | Captive inland feedstock; resilient meal & ethanol exports. |
| Farmers / Originators | Agricultural Producers | Bearish (Income Pressure) | Widening interior basis; lower farm-gate flat prices. |
| Export Infrastructure | Gulf Elevators, Barge Operators | Bearish (Volume Drop) | Low throughput; uncompetitive FOB export pricing. |
| Rail Transport | Grain-Heavy Class I Railroads | Bearish (Freight Rate Softness) | Negative secondary shuttle car bids; lower carloadings. |
| Paper Markets | Chicago Corn & Soybean Futures | Bearish (Flat Price Headwinds) | Inland stock accumulation; lack of export demand. |
8. Second-Order Effects & Catalysts to Watch
-
U.S. vs. South American FOB Spreads: The definitive indicator. U.S. Gulf and PNW offers must price down to parity with Brazil to trigger export demand.
-
Secondary Railcar Shuttle Bids: Watch for a rebound in secondary rail freight premiums as an early indicator that interior elevators are booking harvest capacity.
-
Domestic Processing Margin Curves: Board crush spreads and ethanol crush margins will indicate how effectively processors absorb inland surpluses.
-
Weekly Ratio of Export Sales to Inspections: A rising ratio signals book rebuilding; a falling ratio confirms the export run-down continues.
-
River Freight Rates & Water Levels: Low river freight rates reflect slack demand, whereas any sudden drop in Mississippi water levels could introduce physical transportation bottlenecks on top of price weakness.
The Bottom Line
Record stocks, a record soybean crop, and a near-record corn harvest are colliding with an export pace that continues to lag.
The weakness in downbound barge counts and secondary rail bids is real, but it is a price problem, not a transportation failure. Betting on logistics bottlenecks misses the broader macro setup.
The actionable insight is positioning for the divergence created by uncompetitive exports: bearish flat futures, widening interior basis, and expanding margins for domestic crushers and ethanol processors.
BreakoutBulletin publishes analytical research and education for informed investors. Nothing here is a buy or sell recommendation or personalized investment advice. Figures draw from USDA, Corps of Engineers, and specialist trade sources.