
Market Structure & Capital Flows
By Manish T. · BreakoutBulletin
The AI boom gets read almost entirely through earnings calls and stock prices. A hyperscaler announces a bigger capital-spending number, an analyst nods, the stock moves. But there is a second ledger that measures the same boom without any management framing at all, and it has been flashing a remarkably clear signal: the U.S. trade deficit. AI hardware is physical. Chips, servers, cooling systems, networking gear, and the copper and electrical equipment that wire a data center all have to cross a border and move through a port before they become monetizable compute. That means the buildout shows up in customs data before it shows up in a polished investor deck. The instruction for reading this cycle is simple: follow the cargo, not the commentary.
The Signal in the Numbers
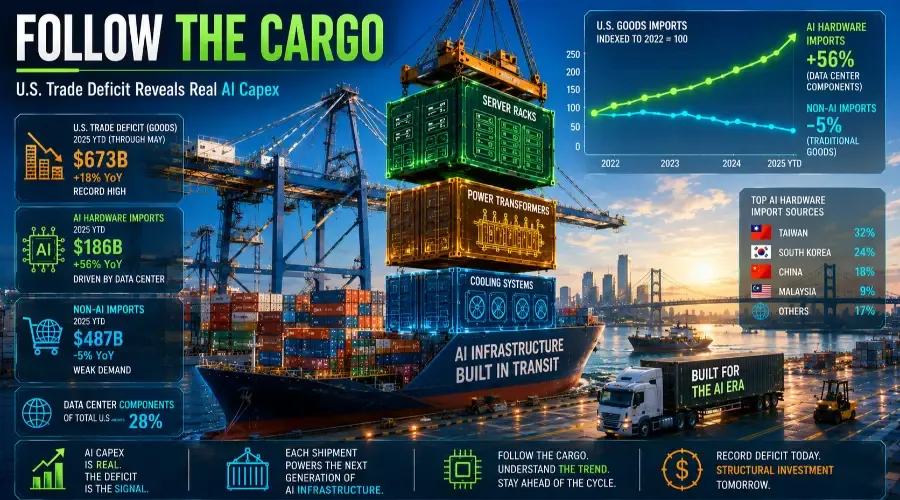
The scale of it is startling once you separate AI-related goods from everything else. Research from the Federal Reserve Bank of Minneapolis found that total dollar imports of AI-relevant products reached $379 billion in 2025, a staggering 72.6% increase from 2023. Imports of AI-relevant goods were about 111% higher in early 2026 than the monthly average in 2023. Over the same stretch, imports of everything not related to AI actually fell 14% and grew only 3% in total over the period. Before 2024 those two lines moved together; now they have split violently apart.
AI-related products now account for 23% of all U.S. imports–up from just 15% in 2023. Absent the AI boom, the U.S. goods trade deficit–which hit a record $1.2 trillion** in 2025–would have been about **$200 billion smaller, or roughly 16% less. U.S. imports of computer hardware and semiconductors alone topped $450 billion in 2025, up roughly 60% in twelve months. This is no longer a niche category. The AI build-out has become large enough to bend the national trade balance.
The Cargo in Context
To put these numbers in perspective: total U.S. imports of data center equipment surged 109% between 2020 and 2025, climbing from $312.7 billion to $653.1 billion–a figure that now represents 18.6% of all U.S. merchandise imports. These imports break down into roughly $580 billion in computing equipment (servers, chips, cooling systems) and over $70 billion in power infrastructure (transformers, switches, batteries). Texas ports alone handled $107.7 billion in data center-related imports in 2025.
Why the Customs Data Is a Good Tell
Here is why this matters as a signal rather than a curiosity. Earnings reflect what management chooses to say and when; they lag, and they come wrapped in narrative. Customs data is the opposite. It is a near-real-time, narrative-free measure of physical activity–an independent second opinion on whether the AI cycle is still deepening. When a company tells you its capital spending is accelerating, that is a claim. When the goods to build that capacity are physically piling up at the ports, that is evidence.
The construction of AI data centers is "very import intensive," and that intensity leaves a trail no press release can dress up. Approximately 90% of equipment goods for high-technology sectors originate abroad, with suppliers concentrated in East Asia. If the imports keep running hot, the buildout is operationally alive, not just rhetorically alive.
It's Not Just Chips
The most common mistake in reading this signal is to look only at semiconductors. The Minneapolis Fed work makes the point directly: focusing on a narrow set of semiconductor codes misses most of the story. The AI-goods footprint spans hundreds of product categories, including some that look nothing like silicon. Imports of refined copper, the metal that wires power through a data center, have jumped roughly 150% since 2023. Specialized cooling equipment, networking hardware, and heavy electrical gear all belong in the same basket.
Geography tells the same story: Taiwan supplies the advanced chips, but Mexico supplies a comparable share of the AI-import total, largely in electrical, cooling, and HVAC systems for the buildings themselves. Mexico is the largest supplier of servers to the U.S. market, followed by Taiwan. The physical AI economy is broader than the chip, and anyone tracking only semiconductor lines is watching a fraction of the cargo.
The Tariff Twist
Here is the part that makes the trade story even more interesting–and more politically complicated. Despite the administration's tariff agenda, 69% of AI-related imports fell on at least one tariff exemption list. The effective tariff rate on AI goods was just 4.5% , compared with 12.1% for non-AI goods. The administration has been carving out exemptions for the very goods driving the buildout.
That creates a policy tension. Tariffs are designed to reduce imports and protect domestic manufacturing. But AI imports are essential to the buildout, and domestic manufacturing still isn't enough to satisfy the data center industry's needs. The result is a de facto industrial policy where the administration talks tough on trade while quietly exempting the inputs it actually needs.
It's Not Just Imports
U.S. exports related to AI have also surged–just not as dramatically. AI-related exports were 35% higher in 2025 than in 2023. But the import surge is far larger in absolute terms, which is why the trade deficit is widening despite the export growth. The U.S. remains a net importer of AI-related goods by a wide margin, and that gap is growing.
What to Watch Next
The next update lands with the monthly U.S. International Trade in Goods and Services release, due in early August. Recent prints have already carried the pressure: the trade deficit jumped more than 40% in one month earlier this year, its largest monthly increase in a year, with semiconductors among the drivers.
Beyond the headline deficit, the higher-frequency reads are worth following:
- Monthly semiconductor shipment data from industry groups
- Freight rates and port congestion–Texas ports are already straining under $107 billion in data center-related imports
- Any sign of lengthening lead times on constrained AI hardware
- Import capital-goods prices–which have been ticking up on computers, peripherals, and semiconductors–the same story showing up as cost rather than volume
- The construction-to-planned ratio for 2026 data centers–currently only about one-third of the 12 GW of planned capacity is under active construction
What Would Change This Read
The signal is powerful in aggregate, but it is noisy month to month, and the noise is the part to respect. Tariffs have reshuffled who the U.S. buys from, pulling imports away from China and toward Southeast Asia, Taiwan, and Mexico, which can distort category comparisons. Sudden shocks trigger stockpiling: after the conflict with Iran, companies front-loaded orders to build inventory buffers, inflating a month's figures for reasons that have nothing to do with underlying AI demand. And trade data captures only the imported slice of AI capital spending; a large share of the buildout, from construction to power to domestically designed chips, never crosses a border at all.
So the durable signal is the trend and the divergence between AI-related and everything-else imports, not any single month's print. This reading weakens if that divergence narrows and AI-goods imports flatten. At that point the customs trail would be telling you the physical cycle is cooling, whatever the earnings calls say.
Specific invalidation triggers:
- AI imports fall below 20% of total U.S. imports on a sustained basis–indicating the buildout is moderating
- Non-AI imports grow faster than AI imports for two consecutive quarters–suggesting the divergence is reversing
- Data center equipment imports decline year-over-year–a clear sign the capital spending cycle is rolling over
- The construction-to-planned ratio rises above 80%–indicating the equipment bottleneck is easing and the import surge is translating into actual buildout
What the Cargo Actually Is
It is worth remembering what these imports physically are, because it connects this signal to the rest of the AI-constraint story. The goods crossing the border are the same items that keep showing up as shortages: the memory and chips feeding the accelerators, the cooling and networking gear, the electrical equipment for the grid connection. The trade deficit is, in effect, the aggregate physical footprint of all those constraints at once, measured in dollars at the dock.
It is also the flip side of the financing story: an import-intensive buildout funded increasingly with debt shows up in two ledgers at the same time–the macro accounts and the credit market. Read together, they describe one cycle from two independent angles.