
The AI Build-Out’s Deepest Bottleneck Isn't Chips or Memory - It's the Power Grid

Explore why 128-week transformer lead times and grid interconnection queues have replaced GPUs as the binding constraint on the AI build-out.

The AI Build-Out’s Deepest Bottleneck Isn't Chips or Memory - It's the Power Grid

AI Infrastructure & Physical Constraints

By Manish T. · BreakoutBulletin

The AI supply story has been told one bottleneck at a time.

First it was GPUs–not enough compute.

Then memory - the RAM being drained and repriced.

Then advanced packaging–the step that assembles the chip.

But suppose, for a moment, that all three get solved.

You have your accelerator, its memory, and a packaging slot.

You still have to plug it in.

That last step turns out to be the hardest of all.

A modern AI campus draws the power of a small city, and the thing standing between it and the grid–an interconnection queue, a transmission line, a high-voltage transformer–runs on timelines measured in years, sometimes a decade.

Somewhere around 2025, the industry's binding constraint quietly migrated from the server rack to the substation.

Power is now the primary limit on how fast AI infrastructure can be built, and it's the one constraint you cannot buy your way past on any near-term schedule.

The Scale of the Demand

Start with how much electricity this actually takes, because the numbers reset your sense of scale.

Data centers were a rounding error in national power demand a few years ago–roughly 4.4% of U.S. electricity in 2023.

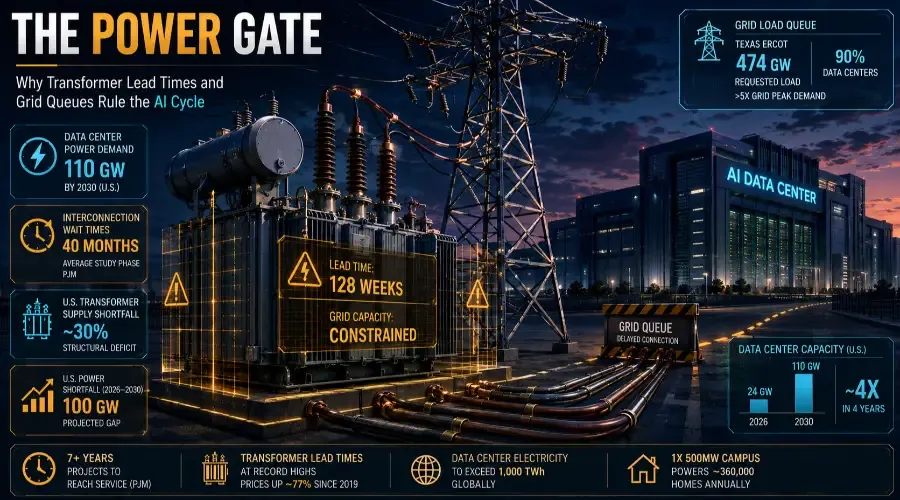
That share is climbing fast, and the capacity math is stark: U.S. data-center capacity is projected to grow from around 24 gigawatts in 2026 to roughly 110 gigawatts by 2030–a near-quadrupling in four years.

A single 500-megawatt AI campus running near full utilization consumes close to 3.9 terawatt-hours a year–about the annual electricity use of 360,000 homes.

Globally, the International Energy Agency expects data-center electricity consumption to pass 1,000 terawatt-hours, up from 460 in 2022.

This is no longer a facilities line item.

It's a load large enough to reshape entire regional grids.

Bank of America projects an even starker gap: between 2026 and 2030, the U.S. could face a 100-gigawatt electricity generation shortfall, with capacity demand expected to reach 230 gigawatts or more while utilities are only projected to deliver about 93 gigawatts.

That's not a tight market–that's a structural crisis in the making.

Why the Grid Can't Keep Up: Generation vs. Load Queues

The first wall is getting permission to connect at all–a structural crisis occurring simultaneously on both sides of the meter.

To understand the grid's gridlock, it helps to separate generation queues (power trying to get onto the grid) from load queues (data centers trying to pull power off the grid):

Supply/Generation Queues: Across the U.S., roughly 2,000 gigawatts of generation and storage sit in interconnection queues–more than the entire installed capacity of the country–waiting for the studies and approvals needed to feed power into the system. However, most of that queue will never be built: of the capacity that entered queues between 2000 and 2018, only about 19% of projects (14% of total capacity) reached commercial operations by the end of 2023.

Demand/Load Queues: On the other side, grid operators are overwhelmed by massive load requests from hyperscalers. In Texas alone, ERCOT is tracking over 474 gigawatts of requested load–more than five times the grid's record peak demand–with 90% attributed to data centers.

This creates a severe double-sided mismatch: new energy generation cannot connect fast enough to supply the grid, while new data center campuses cannot get approval to pull load from it.

Clearing paper queues no longer solves the problem.

PJM, the largest U.S. grid operator, reports that projects reaching service in 2025 took more than seven years end to end.

Typical interconnection wait times in PJM average 40 months just for the initial study phase.

The bottleneck has shifted downstream from paperwork to physical execution: transmission corridors, substation capacity, and high-voltage electrical hardware.

The Bottleneck Behind the Bottleneck: Transformers

That hardware is the quietest and most acute chokepoint of all.

Large power transformers–the refrigerator-to-house-sized units that step voltage up for transmission and back down for use–now carry record lead times.

Prices have risen about 77% since 2019, and the market is running a supply shortfall estimated near 30% for power transformers.

Equipment / Grid Metric Lead Time / Stat Market Impact
Power Transformers ~128 Weeks ~30% Structural Supply Deficit
Generator Step-Up (GSU) Units ~144 Weeks Generation Connection Delays
PJM Interconnection Queue ~40 Months (Study Phase) 7–8 Year Total Project Lifecycle
2026 Data Center Buildout 33% Active Construction ~7–8 GW Delayed or Canceled

The U.S. imports about 80% of its power transformers and 50% of its distribution transformers.

Material bottlenecks - especially in grain-oriented electrical steel (GOES) and copper windings are slowing production.

Data-center developers now find themselves bidding directly against utilities for the same scarce equipment, turning a supply shortage into an outright pricing event.

The shortage has become so acute that developers are turning to used and refurbished transformers sourced from decommissioned power plants.

A single missing transformer can hold up a $2 billion project for over a year.

The 2026 Data Center Stall: A Snapshot

The severity of the equipment bottleneck is visible in real-time execution data.

Half of America's planned 2026 data centers are stalled and not for lack of chips or capital.

Approximately 12 gigawatts of data center capacity was expected to come online in the U.S. in 2026, according to Sightline Climate data, but only about one-third of that capacity is currently under active construction.

That means roughly 7 to 8 gigawatts of planned capacity–representing dozens of facility builds–have been delayed or canceled, held up by shortages of transformers, switchgear, and grid interconnection access.

Hyperscalers are projected to spend $600–650 billion on AI infrastructure in 2026, but that capital is hitting a wall of physical constraints that money alone cannot solve.

Why Power Is a Different Kind of Constraint

Here is what separates power from the chip, memory, and packaging bottlenecks: the timelines don't line up.

A fab, a memory line, or a packaging facility is enormously expensive, but it can be scaled in roughly 12 to 24 months once capital is committed.

Grids, transmission corridors, and high-voltage equipment run on multi-year and sometimes decade-long clocks, governed by permitting, physics, and specialized manufacturing capacity that money alone cannot compress.

Transformer production requires specialized skills–copper winding, core steel assembly, and insulation techniques–that take years to train.

You cannot simply spin up automated factory lines overnight.

That mismatch is the crux.

The compute side of AI can respond to a demand surge within two years; the power side cannot.

So even as chip, memory, and packaging constraints ease, the electricity constraint stays tight–which is why "power availability" has become the single most important site-selection criterion for hyperscalers, ahead of land, tax incentives, or fiber access.

It's the floor beneath every other constraint.

Who Feels It and Where the Cost Lands

The scarcity hands unusual pricing power to specialized industrial links: transformer and switchgear makers, turbine manufacturers reporting multi-year backlogs, and utilities that control grid interconnects.

It also explains why major AI operators are bypassing grid queues entirely and racing toward on-site generation–striking deals for nuclear and small modular reactors (SMRs), or building behind-the-meter gas plants to secure firm power on their own timeline.

The most distinctive part of this bottleneck is where the cost ultimately lands:

  • The memory squeeze lands on device prices.
  • The packaging squeeze lands on chip availability.
  • The power squeeze lands on the electricity system itself–and potentially on consumer rate bases.

Regulators, including leadership at the Federal Energy Regulatory Commission (FERC), have raised concerns about ensuring that ordinary households and small businesses don't end up subsidizing the massive grid upgrades data centers require.

That public-cost friction makes AI power a regulatory and political story, not just a supply-chain one.

The Third Gate on the Same Chip

Step back and this completes the physical bottleneck framework:

  • Memory Shortage: The first physical gate (repricing quarterly).
  • Advanced Packaging: The second physical gate (expanding over 12–24 months).
  • Power & Grid Interconnection: The third and deepest gate (moving over 5–10 years).

A finished AI accelerator must clear all three, and each gate is slower and less visible than the last.

The real shape of the AI supply problem isn't a single shortage to fix; it's a chain of physical constraints stacked in order of how hard they are to scale–with electricity at the bottom, setting the ultimate pace.

What to Watch Next

A few signposts tell you whether the constraint is easing or deepening:

  • Interconnection Reform: Watch whether grid operators transitioning to cluster-based study processes actually shortens queue timelines.
  • Equipment Lead Times: Monitor transformer and switchgear lead times (Wood Mackenzie's 128-week baseline). If lead times stretch further, the equipment bottleneck is winning.
  • On-Site Generation Shift: Track nuclear, SMR, and behind-the-meter gas power purchase agreements as a gauge of hyperscaler independence from grid utilities.
  • Utility Rate Cases: Follow regulatory rulings on who pays for data-center grid upgrades to see how public cost tensions resolve.
  • The Texas ERCOT Audit: Monitor Governor Greg Abbott's audit of data center load queue requests as a key near-term regulatory catalyst.
  • Construction-to-Planned Ratio: Track the proportion of planned capacity under active build (currently 33%). An improving ratio signals equipment bottlenecks are easing.

The Bigger Picture

The lesson underneath all of this is that the AI build-out is bounded by physical reality, not by software demand–and the binding constraint keeps turning out to be something unglamorous, concentrated, and slow to scale.

Chips gave way to memory, memory to packaging, packaging to power.

Each step down the chain, the timelines get longer and the fixes get harder to buy.

Bank of America's 100-gigawatt shortfall projection and developers sourcing refurbished transformers from decommissioned power plants are not isolated anecdotes.

They are signals of a structural mismatch between AI's ambition and the physical world's capacity to deliver.

The companies best positioned for the next phase of the AI build-out will not be the ones with the fastest chips or the most memory–they will be the ones that control the transformers, the switchgear, the interconnection rights, and the power itself.

For anyone trying to read this industry, the durable habit is to stop watching the thing everyone else is watching and trace the chain to its slowest link.

Right now, that link runs through a substation–and it will still be there long after the chip headlines have moved on.

Related Reading

The Memory Shortage Behind the AI Boom → https://www.breakoutbulletin.com/article/ai-memory-shortage-hbm-dram-spillover-analysis

It's Not the Wafer Anymore (Advanced Packaging) → https://www.breakoutbulletin.com/article/advanced-packaging-ai-chip-bottleneck-cowos-tsmc

The AI Boom Is Now Running on Debt (Credit) → https://www.breakoutbulletin.com/article/ai-boom-debt-bond-market-repricing

AI Compute Is Quietly Turning Into a Utility Business (Leases) → https://www.breakoutbulletin.com/article/ai-boom-15-year-data-center-leases

Follow the Cargo: The AI Boom in the U.S. Trade Deficit → https://www.breakoutbulletin.com/article/ai-boom-customs-data-us-trade-deficit

Disclaimer

BreakoutBulletin publishes educational and analytical content only. Nothing here is investment, financial, legal, or tax advice, or a recommendation or solicitation to buy, sell, or hold any security. Industry, grid, and equipment figures reflect information available as of the publication date and are drawn from public sources (including grid-operator data, government and industry research); figures may be revised. Past performance does not indicate future results. Readers should conduct their own research and consult a qualified, registered financial adviser before making any decision.

Data Sources

  • Wood Mackenzie – Transformer lead times Q2 survey (128 weeks power, 144 weeks GSU) & 30% transformer deficit
  • Lawrence Berkeley National Laboratory – Queued Up report (19% completion rate from 2000–2018 queues)
  • Bank of America Global Research – 100 GW U.S. power shortfall projection (2026–2030)
  • Sightline Climate / Bloomberg – 12 GW planned 2026 capacity analysis (1/3 active construction ratio)
  • PJM Interconnection – Interconnection queue wait times (40-month average study phase)
  • ERCOT / Texas Governor's Office – Interconnection queue analysis (474 GW load queue, 90% data centers)