
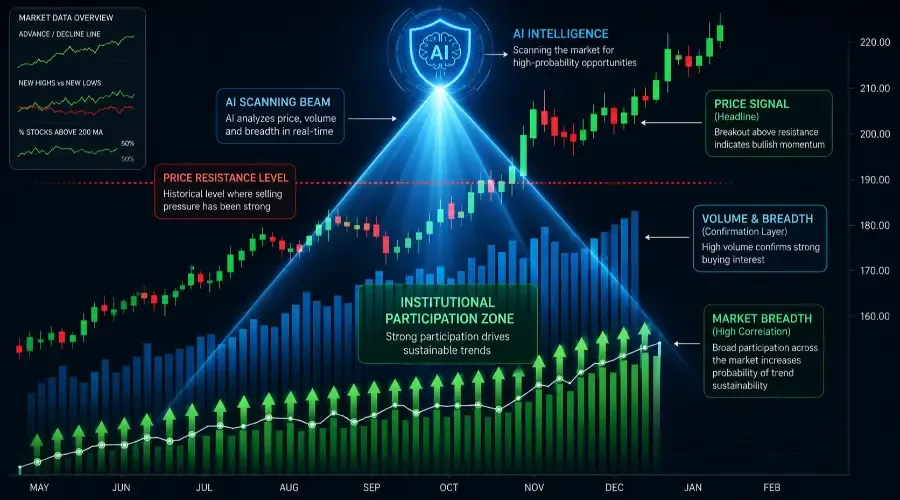
That distinction is what separates traders who get caught in false breakouts from those who sidestep them.
A stock breaking to new highs on thin volume is not the same event as a breakout on twice the daily average volume. An index rally where 85% of stocks are advancing is not the same as a rally driven by five large-cap names while most of the market sits flat. The price action looks identical on the surface. The underlying participation is completely different.
Volume and breadth are the confirmation layer for every technical setup. They don't generate the trade idea – price structure does that. What they tell you is whether the move has enough participation behind it to follow through, or whether it's a surface-level move that's likely to reverse.
AI processes this data well when you give it the right inputs. This post covers exactly what to paste, how to structure the prompt, and what the output tells you – including how to use that output to calibrate position sizing, not just assess the setup.
Volume and breadth form the confirmation layer for every technical setup. Technical Analysis with AI covers the hub overview and how this layer connects to the pattern identification and momentum analysis that precede it.
One important note before diving in: Standard AI models don't have access to live market data. They can only work with what you paste into the prompt. That's why the data inputs in this framework matter as much as the prompts themselves. The model has no idea what the current S&P 500 breadth readings are, what sector rotations happened last week, or what relative volume looked like on Tuesday's breakout – unless you tell it. Every number in this workflow needs to come from you.
Why Volume and Breadth Are the Confirmation Layer
Every technical setup – a breakout, a bounce off support, a pattern completion – produces a price signal. That price signal is the trigger. Volume and breadth are the evidence that the trigger is real.
The mechanism is straightforward. Price moves happen for one of two reasons: genuine participation by a meaningful number of market participants transacting at a price, or a lack of sellers willing to defend a level that allows price to drift higher without meaningful buying behind it. The first type of move tends to sustain. The second tends to reverse.
Volume measures participation at the individual stock level. When a stock breaks to new highs on significantly above-average volume, buyers were actively competing to own the stock at those prices – which creates the momentum that sustains a breakout. When a stock breaks to new highs on below-average volume, the move may simply reflect a temporary absence of sellers rather than genuine buying conviction.
Breadth measures participation at the market level. When an index moves higher and the majority of its constituent stocks are also moving higher, the rally has broad participation – it's a genuine market move. When an index moves higher while the majority of its stocks are flat or declining, the rally is narrow – concentrated in a small number of names whose index weighting pulls the headline number up while the underlying market isn't actually healthy.
Both dimensions should be evaluated before acting on a technical setup. AI helps you structure and interpret both.
Volume Analysis – What to Paste
Keywords: relative volume breakout strategy, volume analysis trading AI
For individual stock volume analysis, four pieces of data give the model what it needs for a meaningful assessment.
Relative Volume
The ratio of current volume to the average daily volume over the prior 20 sessions. This is the primary volume metric for assessing whether a move has meaningful participation.
Relative volume above 1.5x average on a breakout day is generally considered confirming – it suggests significantly more participants than usual were transacting in the direction of the move. That said, context matters here. A low-float small-cap doing 1.5x might be routine; a mega-cap at 1.5x is genuinely significant. A large-cap at 1.3x in a thin overall market session may carry more weight than the same reading on a high-volume tape day. State the number precisely, but let the AI apply context – and if you know the stock type, include it.
State relative volume as a specific ratio – "1.8x the 20-day average" – not a vague description like "high volume." The model needs the number to conduct any precise assessment.
Up/Down Volume Ratio
The ratio of volume on advancing days versus declining days over a defined recent period. This tells you whether buying or selling pressure has been dominant in recent sessions, independent of the price outcome each day. A stock declining on below-average volume but advancing on above-average volume – even if the price hasn't moved dramatically – has a constructive volume profile that supports a bullish thesis.
Volume at Key Levels
The specific volume readings during sessions where price interacted with significant levels – the breakout day, the support test, the resistance reaction. These are the most meaningful data points for assessing whether a level held or broke with genuine participation.
Volume Trend During Consolidations
In a flag, base, or consolidation pattern, volume should ideally be declining through the consolidation period – indicating sellers are not actively distributing into the sideways price action. State whether volume has been declining, flat, or elevated during a consolidation and for how many sessions.
A complete volume input for a breakout setup:
Volume data for [ticker] over the last 10 sessions:

Session-by-session relative volume (vs 20-day average):
Jan 6: 0.8x (down day)
Jan 7: 1.1x (up day)
Jan 8: 0.7x (down day)
Jan 9: 0.9x (sideways)
Jan 10: 2.4x (breakout day – price closed above prior resistance at $148.20)
Jan 13: 1.2x (up day, follow-through)
Jan 14: 0.6x (slight pullback)
Jan 15: 0.8x (sideways)
Jan 16: 0.7x (sideways)
Jan 17: 1.6x (up day, approaching prior resistance from below)

Breakout session (Jan 10): volume was 2.4x the 20-day average. Price
closed at $149.80, above the prior resistance at $148.20 that had held
for 4 sessions.

Prior consolidation (Jan 6–9): volume declined steadily from 0.8x to
0.7x – sellers were not active during the consolidation.

Stock type: mid-cap software name, average daily volume approximately
3.2 million shares.
Note the stock type addition at the end. That context helps the model calibrate whether the relative volume readings are meaningful for this specific name rather than applying a one-size-fits-all threshold.
Breadth Analysis – What to Paste
Keywords: market breadth indicators ChatGPT, how to analyze market breadth with AI, market breadth divergence signals
Market breadth data measures the health of the broader market environment where individual setups are occurring. For a swing trade in an individual stock, the breadth picture tells you whether the wind is at your back – or whether the headline index is concealing a deteriorating internal environment.
Four breadth metrics provide the most actionable inputs.
Advance-Decline Line
The cumulative count of advancing stocks minus declining stocks across a defined universe – typically the NYSE or S&P 500. A rising advance-decline line alongside a rising index confirms broad participation. A declining advance-decline line while the index is rising is a divergence – it signals that index gains are being driven by a narrow group while most of the market isn't participating.
State the advance-decline reading as a direction and a timeframe: "The NYSE advance-decline line has been declining for 8 sessions while the S&P 500 index has been flat to slightly higher" gives the model more to work with than "breadth is weak."
New Highs Versus New Lows
The number of stocks making 52-week highs versus 52-week lows on a given day or over a recent period. In a healthy market, new highs should expand as the index rises. When new lows are expanding alongside a rising index – or when new highs are declining despite an index at or near all-time highs – it signals internal deterioration that price alone doesn't reveal.
Percentage of S&P 500 Stocks Above Their 200-Day Moving Average
This is one of the most useful single breadth metrics because it measures how broad the long-term participation is across the index. When more than 60% of S&P 500 stocks are above their 200-day MA, the broad market is in a healthy trending environment. When less than 40% are above their 200-day MA, the index-level performance is masking significant underlying weakness – even if the index itself hasn't broken down.
Important nuance: directionality matters as much as the absolute level. A reading of 55% that's rising from a recent low of 42% signals a different environment than 55% that's declining from 70%. Include the trend direction, not just the snapshot number.
Percentage of Stocks Above Their 50-Day Moving Average
A shorter-term version of the 200-day metric that's more sensitive to near-term conditions. Useful for assessing whether a recent index move has broad short-term participation or whether it's concentrated in a narrow group of momentum names.
A complete breadth input:
Market breadth data as of [date]:

NYSE advance-decline line: has declined for 6 consecutive sessions
while SPY has been flat over the same period.

New highs vs new lows (S&P 500):
Jan 13: 48 new highs, 31 new lows
Jan 14: 42 new highs, 38 new lows
Jan 15: 39 new highs, 44 new lows
Jan 16: 35 new highs, 52 new lows
Jan 17: 31 new highs, 61 new lows

S&P 500 stocks above 200-day MA: 44% as of Jan 17, down from 58%
three weeks ago.
S&P 500 stocks above 50-day MA: 38% as of Jan 17.

SPY price over the same period: +0.4% – essentially flat while breadth
has deteriorated.
Note the addition of the 200-day MA trend – "down from 58% three weeks ago." A static reading of 44% tells the model a level. A directional reading tells the model whether conditions are worsening or recovering, which changes the interpretation meaningfully.
Breadth data informs not just individual setup confirmation but the broader watchlist context. How to Build a Daily Watchlist Using AI Sector Analysis covers how sector breadth fits into the top-down watchlist process and what thresholds signal healthy versus deteriorating market internals.
How to Structure the AI Prompt
Keywords: AI prompts for technical analysis, AI stock analysis
Volume and breadth should be interpreted together because they address different levels of the same question: does this move have genuine participation behind it? Volume answers it at the individual stock level. Breadth answers it at the market level.
The most effective prompt structure combines both inputs and asks the model to assess them as a unified picture.
Complete volume and breadth prompt:
Act as a technical analyst reviewing volume and market breadth data
to assess the confirmation environment for a swing trade setup.

Setup context: I'm evaluating a long setup in [ticker] on the daily
chart. Price broke above resistance at [level] on [date]. I am
assessing whether the volume and breadth conditions support following
through on this setup.

Stock type: [include market cap range and average daily volume]

Individual stock volume data: [paste]

Market breadth data: [paste]

Based only on the data I've provided:

(1) Assess whether the volume on the breakout session was sufficient
to be considered confirming – reference the specific relative volume
figure and apply appropriate context for this stock type.

(2) Assess the volume trend during the prior consolidation – was it
consistent with healthy accumulation or does it raise concerns about
distribution?

(3) Evaluate the current market breadth environment – does the breadth
data suggest the broader market is healthy enough to sustain an
individual stock breakout, or does the internal deterioration represent
a headwind? Factor in the direction of breadth trends, not just the
current level.

(4) Identify any divergence between the price action and the volume
or breadth data – and explain what that divergence typically suggests
about the sustainability of the move.

(5) Conclude with a confirmation summary:
- State whether the overall confirmation is High, Partial, or Low
  based on which conditions are met and which are absent.
- Frame what that confirmation level suggests about position sizing
  calibration relative to a standard baseline.

No directional recommendation. Frame as a confirmation assessment –
what the data supports and what it raises questions about.
The confirmation summary at the end is the addition that makes this prompt practically useful rather than just informative. High / Partial / Low gives you a scannable output. The position sizing frame ties the analysis directly to risk management without the model making a trade call.
One important verification step: Before acting on any AI output from this workflow, check that the model correctly referenced the numbers you pasted – particularly relative volume figures, breadth thresholds, and trend directions. Models can occasionally misread pasted tables or apply thresholds mechanically without the contextual nuance you included. Treat the output as a structured first read, not a final verdict. Your own chart and judgment remain the final filter.
What Divergence Between Price and Volume or Breadth Signals
Keywords: market breadth divergence signals
Divergence – when price and volume or breadth move in opposite directions – is one of the most consistently useful signals in technical analysis. It typically does one of two things: warns that a move lacks underlying support to sustain it, or signals that selling pressure is exhausting before price has reflected the shift.
The most common and actionable forms:
Price Rising, Breadth Falling
The index or sector moves higher while the advance-decline line declines and an increasing percentage of stocks trade below their key moving averages. This is the classic internal deterioration signal – the headline number is being pulled up by a small number of heavily weighted names while the broader market isn't participating. Individual stock breakouts in this environment face a structural headwind even when the setup looks technically clean.
If you're looking at the chart while reviewing the AI's assessment of this divergence, you'd typically see the index making higher highs while a breadth oscillator like the McClellan Oscillator or the advance-decline line makes lower highs alongside it. That visual confirmation helps you sanity-check what the AI's structural assessment is describing.
Price Rising, Volume Declining
A stock advancing on progressively declining volume – particularly when approaching a key resistance level – suggests the move may lack conviction to sustain a breakout. Buyers are not adding positions aggressively as price approaches resistance, which raises the possibility that sellers at the resistance level have sufficient force to turn the move back.
Price Declining, Volume Declining
A pullback on declining volume is generally constructive for a bullish thesis – sellers are not actively distributing, and the pullback may simply reflect a temporary absence of buyers. This is the volume pattern a healthy flag or consolidation should exhibit.
Price Declining, Breadth Improving
Less common but worth noting: when an index is declining in price but the advance-decline line is improving and new highs are expanding relative to new lows, it may signal that the decline is concentrated in heavily weighted names while the broader market is quietly strengthening. This type of divergence has sometimes preceded the early stages of a rotation or reversal.
When you identify a potential divergence in your data, describe it explicitly in your prompt and ask the model to frame what the divergence typically suggests and what conditions would resolve it in one direction or the other.
How to Identify When a Breakout Has Real Participation
Keywords: relative volume breakout strategy, AI stock analysis
The most immediately practical application of this framework is the breakout assessment – determining whether a price break above resistance is backed by participation that sustains a move, or whether it's a surface-level break likely to reverse.
Three conditions together constitute a high-confidence breakout confirmation:
Condition 1 – Individual Stock Volume
Relative volume above 1.5x average on the breakout day is generally considered confirming. Below that threshold, the breakout is worth treating with caution. Again, context matters: this threshold is a starting point, not a universal rule. Apply it relative to the stock's typical behavior and the broader market volume environment that day.
Condition 2 – Breadth Environment
More than 60% of S&P 500 stocks above their 200-day MA suggests a healthy underlying environment where breakouts are more likely to sustain. Below 40% suggests a deteriorating environment where technically clean setups may face headwinds from the broad market. A reading between 40% and 60% that's trending in either direction adds meaningful context – a rising 52% is a different environment than a falling 52%.
Condition 3 – Breadth Thrust (Rare Signal, Longer-Term Context)
On occasions when more than 90% of stocks advance in a single session – a historically rare event – it represents a breadth thrust that has typically been a meaningful bullish signal for the broader market. This is not a setup-level confirmation tool in the way the first two conditions are. It's a macro-level signal that, when present, can provide a strong broader tailwind. Include it in your prompt data if it occurs in your lookback window, but treat it as a longer-term context signal rather than a daily setup condition.
When all three conditions align, the case for a breakout setup is at its strongest. When one or more are absent, the setup may still work, but the confirmation picture is incomplete. Ask the model to explicitly assess which conditions are confirmed and which are absent – that output directly informs whether you're looking at a standard, reduced, or zero-size entry.
SPY's Late October 2023 Rally – A Narrow Rally Identified
Keywords: how to analyze market breadth with AI, market breadth divergence signals
Here's a concrete example of how breadth analysis with AI identified a problematic rally environment – and what happened after.
The Context
October 2023 was a difficult month for U.S. equities. SPY had been under pressure from rising Treasury yields, declining from roughly $450 in late July to below $415 by late October. In the final week of October, SPY began to recover – the index posted positive sessions, and a surface read of the chart suggested the selling pressure was abating.
The Breadth Data That Told a Different Story
Despite SPY's recovery, the internal breadth data was substantially weaker than the index performance suggested.
Market breadth data – late October 2023:

S&P 500 stocks above 200-day MA: 44% – below the 50% midpoint, and
declining from 58% six weeks earlier.
S&P 500 stocks above 50-day MA: 32% – significantly below 50%,
indicating the majority of the index was still in a short-term
downtrend despite the index-level recovery.
NYSE advance-decline line: modestly positive over the recovery sessions
but well below levels seen when SPY last traded at these prices in July.
New highs vs new lows: new lows still exceeding new highs on most
sessions during the surface-level index recovery.
SPY advancing sessions during recovery: averaged 0.85x the 20-day
average volume – below average on the up days.The Prompt
Act as a technical analyst reviewing market breadth data alongside
index price action to assess the health of a recent SPY recovery.

SPY price action: recovered approximately 2.1% over the past 5 sessions
after a decline from $450 to a low of $412.

Breadth data: [paste above]

Volume: SPY advancing sessions over the recovery period averaged 0.85x
the 20-day average volume.

Based only on this data:

(1) Assess whether the breadth data supports characterizing this as a
broad market recovery or a narrow rally concentrated in a small number
of names.

(2) Identify any divergences between the index price action and the
breadth indicators.

(3) State what the breadth data suggests about the sustainability of
the index-level recovery.

(4) Identify what breadth conditions would need to appear to confirm
this as a genuine broad market reversal rather than a narrow bounce.

(5) Provide a confirmation summary – High, Partial, or Low – and frame
what that level suggests about positioning calibration.
What the Analysis Produced
The model characterized the rally as narrow and concentrated. With only 32% of constituent stocks above their 50-day moving average, the recovery was being driven by a small number of large-cap names with sufficient index weighting to pull the headline number higher while most of the market remained in short-term downtrends.
The key divergence identified: new lows continuing to exceed new highs during sessions where SPY posted gains. The index rising while an increasing number of individual stocks make new 52-week lows is inconsistent with a genuine broad reversal.
The confirmation summary came back as Low – advancing on below-average volume, breadth deteriorating, and no expansion in new highs. The model framed that as a setup environment warranting meaningfully reduced positioning relative to a standard baseline.
What Happened Next
SPY went on to retest the October lows before a genuine breadth improvement – advancing stocks expanding, new highs recovering above new lows, and above-average volume on the up sessions – accompanied the November rally that followed. The breadth analysis identified the structural weakness before the retest, not after.
That's the practical value of running this framework: not predicting what happens next, but understanding what the current participation data actually supports versus what the headline price suggests.
Integrating Volume and Breadth Into the Daily Workflow
Keywords: AI prompts for technical analysis, volume analysis trading AI
Volume and breadth data doesn't require a separate research session – it integrates into the pre-market briefing and watchlist-building process.
The breadth data – percentage of stocks above their 200-day MA, advance-decline direction, new highs versus new lows – is available from Finviz's market overview and StockCharts' breadth indicators each morning. It takes 3–4 minutes to note and paste. This context sets the environmental frame for every individual setup you evaluate that day.
The individual stock volume data for active watchlist names comes from the same OHLCV table you're already pulling for technical analysis. Relative volume is available directly on Finviz's stock page and TradingView's data display. Adding a volume column to your existing technical analysis input takes minimal additional time.
Practical cadence:
Daily, pre-market or post-market:
Run the breadth snapshot – 200-day MA percentage, advance-decline direction, new highs vs new lows. This establishes the macro weather before you evaluate any individual setup.
As needed, when a setup triggers:
Run the individual stock volume analysis whenever a watchlist name hits a price alert or completes a breakout structure.
The combined picture – individual setup quality assessed against the broader participation environment – is what distinguishes a complete technical analysis from one that evaluates setups in isolation from the market conditions surrounding them.
Frequently Asked Questions
Keywords: AI stock analysis, market breadth indicators ChatGPT, AI prompts for technical analysis
Q1: Can't I just upload a screenshot of my stock chart to the AI instead of pasting raw numbers?
Multimodal AI models can look at images, but they're prone to visual inaccuracies when estimating exact numbers on a chart axis. For high-precision technical analysis – like determining whether relative volume is exactly 1.5x or 1.8x the 20-day average – feeding the AI exact, chronological text data produces significantly more accurate and logic-driven responses. Screenshots are useful for general pattern recognition. For the kind of precise confirmation assessment this framework covers, paste the numbers.
Q2: Which market breadth indicator is the most critical to feed the AI?
The percentage of S&P 500 stocks above their 200-day moving average is generally the most useful single metric for macro health. It filters out short-term noise and tells the model whether the broad market is in a structural uptrend (above 60%) or whether a handful of mega-cap names are propping up a decaying internal environment (below 40%). Include the trend direction alongside the current reading – a rising 52% and a falling 52% describe different environments even though the number is the same.
Q3: What should I do if the AI detects a strong breakout on an individual stock but a severe divergence in market breadth?
Respect the macro environment. A technically clean individual setup entering a weak, narrow market faces real structural headwinds. Rather than skipping the trade entirely or ignoring the warning, use the breadth divergence to adjust your execution: consider reducing your standard position size meaningfully, tighten your stop-loss levels, and take profits more aggressively rather than waiting for a large follow-through that may not come. The AI's confirmation summary – High, Partial, or Low – is designed to make this calibration explicit rather than leaving it to interpretation.
Q4: Do I need a paid AI subscription or real-time data plug-ins for this workflow?
No. Because this method relies on you sourcing the data from free platforms like Finviz or TradingView and pasting it directly into the prompt, you can run this workflow with standard AI models. The model doesn't need live web-browsing capabilities if you provide the complete data state inside the prompt. The data sourcing is your job. The interpretation and structure are the AI's job.
Q5: How often should I run this combined volume and breadth analysis?
Run the market breadth snapshot once a day during your pre-market or post-market prep to establish the macro environment. Run the individual stock volume analysis dynamically – whenever a watchlist name triggers a price alert or completes a breakout structure. The two work together: breadth sets the backdrop once daily, volume assessment runs on demand as setups develop.