
Earnings season is where trading edges get made and lost faster than almost any other time in the market calendar.
A company beats estimates by a wide margin and the stock drops 8%. Another misses on revenue but rallies 12% on raised guidance. A third hits every number but trades sideways because the market already priced in the beat three weeks ago. The headline figures – EPS beat, revenue beat, miss – tell you what happened. They rarely tell you why the stock moved the way it did, or what it's likely to do next.
The traders who navigate earnings well are not the ones who react fastest to the headline. They're the ones who understand what the report actually says – the guidance tone, the margin trajectory, the language shifts in management commentary, the analyst questions that surfaced the real concerns. That understanding used to require reading a 40-page document carefully and knowing what to look for. With AI, it requires knowing how to ask the right questions of the right material.
This post covers exactly that process.
Earnings analysis is one of the core tasks in the daily workflow. Daily Trading Workflow with AI covers how it fits into the full five-stage system and when in the session it typically runs.
What to Collect Before You Start
The quality of an AI earnings analysis is determined by the completeness of the material you bring to it. A prompt built around headline figures alone will produce headline-level analysis. A prompt built around the full earnings package will produce something you can actually trade from.
Four documents make up a complete earnings package:
The earnings press release
This is the official document the company files with the SEC as an 8-K at the time of the earnings announcement. It contains the headline EPS and revenue figures, the segment-level breakdown, gross and operating margin data, and the formal guidance statement for the next quarter. Pull it directly from the company's investor relations page or SEC EDGAR.
The earnings per share (EPS) figure and estimate
The reported EPS alongside the Wall Street consensus estimate. The beat or miss, and its magnitude, is the starting data point. Source this from a reliable financial data provider (e.g., Yahoo Finance, Seeking Alpha, or your broker's research platform).
The guidance statement
Many traders skip past the guidance in favor of the headline figures, which is exactly backwards. The market prices the future, not the past. Copy the guidance language verbatim from the press release. Do not paraphrase it before pasting. The specific words management chose matter.
The earnings call transcript
The prepared remarks and Q&A section of the earnings call contain information that does not appear anywhere in the press release – management tone, analyst concerns, color on specific business segments, and forward-looking commentary. Seeking Alpha and The Motley Fool publish transcripts within a few hours of most major earnings calls.
⚠️ A Note on Data Privacy: While you are pasting corporate documents and public financial metrics into public LLMs, ensure your data privacy settings are maximized (e.g., turning off model training history). Never paste your personal trading portfolio sizes, account numbers, or broker API keys alongside these corporate data sets.
How to Structure the AI Prompt for Earnings Analysis
With your earnings package collected, you move into Claude or GPT-4o. The prompt structure follows the same framework as every analytical task in this series – role, context, data, specific task, constraints – applied to the earnings context.
Plaintext
"Act as a fundamental analyst reviewing [Company]'s [Quarter] earnings release.
I've provided the following material:
– Earnings press release: [paste]
– Reported EPS vs estimate: [e.g.,6.03 reported vs 5.25 estimate]
– Guidance statement: [paste verbatim from press release]
– Earnings call transcript excerpt: [paste prepared remarks and relevant Q&A sections]
Based only on the material I've provided:
(1) Assess the EPS result – was the beat or miss material enough to typically drive a significant price reaction, and what does the magnitude suggest?
(2) Analyse the guidance statement – was guidance raised, maintained, or lowered, and what does the specific language signal about management's confidence in the next quarter?
(3) Identify any shifts in language or tone between this quarter's materials and the prior quarter framing I've described – particularly around margins, specific business segments, and risk factors.
(4) Flag anything in the transcript that a headline reader would likely have missed but that could be material to the stock's near-term direction.
Confirm any financial figures directly from the material I've provided. Do not introduce external information."
The instruction to confirm figures from the provided material is not optional. Even when you've pasted the correct numbers, the model can occasionally reference a figure in a way that introduces a rounding error or conflates two different metrics. The instruction prompts the model to source its references explicitly from your input.
The press release gives you the numbers. The transcript gives you the story behind them — the management tone, the guidance language qualifiers, and the analyst questions that surface the real concerns. How to Analyze Earnings Transcripts with AI covers the full extraction process for the signal that the headline reader misses.
What to Ask AI to Look For
Beyond the structured prompt above, there are specific analytical angles worth prompting for in earnings analysis – elements that are easy to miss in a manual read and that AI extracts efficiently when asked directly.
| Analytical Vector | What the AI Analyzes | Why It Matters For Your Edge |
|---|---|---|
| Beat/Miss Magnitude | EPS outperformance relative to a 5% threshold. | Beats under 2% are often already priced in by options positioning. |
| Guidance Alignment | Forward metrics vs. current-quarter results. | A "current beat + forward miss" is a prime setup for an open-and-fade session. |
| Margin Trajectory | Gross and operating margins YoY and QoQ. | Reveals if a company is buying revenue growth at the expense of structural profitability. |
| Language Shifts | Ingestion of words like "headwinds" or "cautious." | Nuanced modifications reveal underlying corporate anxiety before it hits the numbers. |
| Q&A Clustering | Recurring themes pressed by multiple analysts. | Highlights exactly where institutional money perceives the real forward risk to be. |
How to Form a Trade Thesis – Not the Trade Itself
This distinction matters enough to state directly.
AI earnings analysis produces a structured understanding of what the report says and what it may signal. It does not produce a trade. The gap between those two things is where your judgment, your risk management rules, and your strategy specifics live.
A complete earnings analysis might conclude: the EPS beat was material at 15% above consensus, guidance was raised by 3% for next quarter, management tone was notably more confident on infrastructure demand than last quarter, and analyst questions clustered around capital expenditure pace rather than demand concerns. That's a set of inputs to a trade decision – not the decision itself.
What you do with that analysis depends on factors AI cannot assess: where the stock is trading relative to its technical structure, how the broader market is positioned going into the report, what your current portfolio exposure looks like, and whether the options market had already priced in a massive implied move.
💡 The Reality Check: Remember that even a structurally flawless fundamental earnings report can be instantly overridden by external, unmodelable factors–such as an intra-day geopolitical headline or an unexpected broad-market "risk-off" cascade. The fundamental picture and the macroeconomic/technical setup must align before a trade thesis becomes an entry.
Use the AI earnings analysis to answer: what does the report actually say? Use your own judgment and your full market context to answer: what do I do about it?
The Verification Step for Earnings Analysis
The verification rule applies throughout this series, but earnings analysis has a specific version of it worth stating explicitly.
Every financial figure in the AI output – EPS reported, EPS estimate, revenue figure, margin percentage, guidance range – needs to be traced back to the source material you pasted. Not because the model is unreliable in general, but because earnings documents contain a large number of similar-looking figures and the model can occasionally conflate them.
An operating margin and a gross margin can look similar in a raw table. A GAAP EPS and a non-GAAP EPS figure often appear in the same release and mean completely different things.
Before any figure from the AI earnings analysis informs your trade reasoning, confirm it against the original press release or transcript. This takes 3 to 5 minutes on a standard earnings report and catches the category of error most likely to affect earnings analysis specifically.
If you're using earnings results to decide which companies deserve deeper fundamental research, How to Do Fundamental Stock Screening with AI covers how to take a post-earnings screener output and run it through AI to rank candidates by quality—not just by the size of the beat.
Meta Q3 2024 – A Complete Earnings Analysis Walkthrough
Here's what a full AI-assisted earnings analysis looked like in practice, using Meta's Q3 2024 earnings release.
The Headline Figures
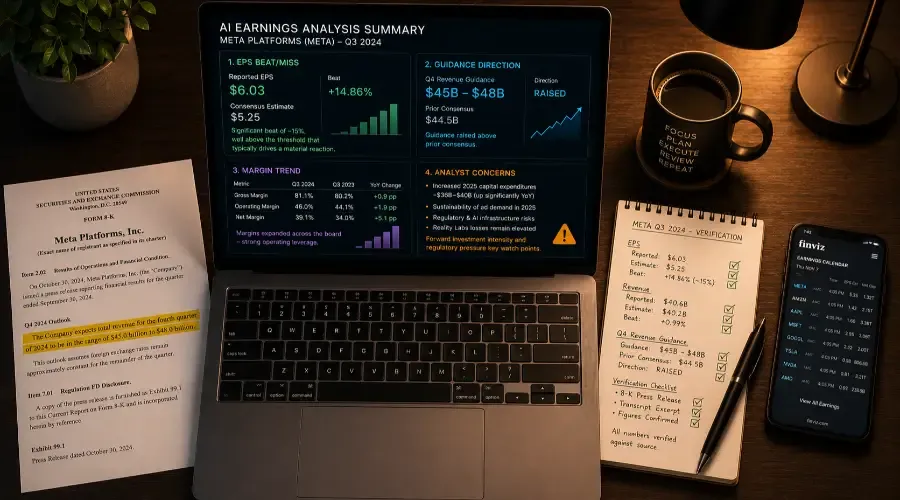
Meta reported EPS of 6.03, significantly above the consensus estimate of 5.25 – a beat of approximately 15%, well above the threshold that typically drives a material price reaction.
Revenue came in at 40.6 billion, above the 40.2 billion estimate. The company also raised its Q4 revenue guidance to a range of 45 billion to 48 billion, above prior consensus of $44.5 billion.
What the AI Analysis Surfaced Beyond the Headline
The headline read was straightforward – big beat, raised guidance, stock higher. However, when the earnings press release financials, the guidance range, and the transcript excerpt covering the prepared remarks and Q&A were pasted into Claude, the AI identified two critical inputs a headline reader missed:
New Performance Metrics
The 20% ad delivery efficiency improvement language was completely new in Q3. The prior two quarters had referenced AI improvements only in vague, general terms. The addition of a specific figure in Q3 represented a structural confidence level in management's AI narrative that hadn't been present before.
The Forward Capital Expenditure Risk
While the current quarter was pristine, management guided for significantly higher capital expenditures (capex) in 2025 to build out AI infrastructure. The AI prompt accurately flagged that three separate analysts aggressively pressed on whether this investment trajectory was justified. The AI output framed this cleanly: the Q3 report was a strong fundamental beat, but the forward narrative was being actively contested by analysts worried about future margin compression.
That nuance – a strong quarter with a highly contested forward investment thesis – was the data that actually mattered for a swing trade decision on Meta heading into Q4. The headline told you the quarter was good. The AI analysis told you where the next quarter's structural debate was going to be.
Common Earnings Analysis Mistakes AI Can Help You Catch
Reacting to the headline before reading the guidance
The EPS figure tells you about the quarter that just ended. The guidance tells you about the quarter the market is actively trying to price.
Confusing GAAP and non-GAAP figures
Companies highlight non-GAAP EPS in press releases because it is typically more flattering by stripping out stock-based compensation. An AI prompt that explicitly asks the model to identify both figures and calculate the gap keeps this structural risk visible.
Missing the guidance language qualifier
Management rarely says "we will" – they say "we expect," "we anticipate," or "we are targeting." AI analysis that is specifically prompted to parse the guidance language verbatim captures these legally defensive hedges.
Ignoring what isn't said
Sometimes the most important signal is the topic management omitted. If analysts asked about a specific regulatory risk last quarter and management provided no update this quarter, that absence is an active data point.
Building Earnings Analysis Into Your Workflow
Earnings season analysis fits into your daily execution workflow at two distinct inflection points based on corporate reporting schedules:
After-Hours Reports (PM)
Run the deeper analysis–transcript extraction, guidance assessment, and analyst Q&A review–the evening before. Transcripts are generally available via major financial portals within 2 to 3 hours of the call close.
Pre-Market Reports (AM)
Companies reporting before the open usually release their 8-K by 7:00 AM ET, but the earnings call transcripts don't populate until mid-morning or mid-session. For AM reporters, run your initial AI review on the press release and guidance statement immediately, and update the prompt with the transcript components later during market hours or post-close.
The Execution Checklist
Keep this quick-start reference open on your desk during heavy earnings weeks to ensure your workflow remains completely systematic:
[ ] Press Release (8-K): Downloaded directly from the official Investor Relations page or SEC EDGAR.
[ ] Consensus Data: Recorded the official Wall Street consensus EPS and Revenue estimates.
[ ] Verbatim Guidance: Copied the exact guidance language without modification.
[ ] Transcript Excerpt: Sourced the prepared remarks and Q&A block (Seeking Alpha/Motley Fool).
[ ] Verification Step: Cross-checked the AI's output figures against your source texts to ensure GAAP/Non-GAAP alignment.
Learning how to analyze earnings reports with this AI-driven method transforms a time-consuming manual process into a repeatable, 15-minute system. By focusing on the full earnings package-not just the headline beat or miss-you build a comprehensive fundamental view that can be cross-checked against technical and macro conditions. This approach ensures you're always trading what the report actually says, not what the headline suggests.
Earnings Report Analysis with AI: Frequently Asked Questions
Can I use this AI workflow for small-cap stocks that lack transcripts?
Yes. If a micro-cap or small-cap stock does not host an analyst call (meaning no transcript is generated), you can modify the prompt to focus strictly on the official SEC 8-K filing or press release. Direct the AI to focus heavily on the inventory levels, accounts receivable, and localized guidance statements within the release text.
How long does a full AI-assisted earnings review take to execute?
Once you have collected the core documents, the actual prompt execution, analysis generation, and personal verification step takes between 10 to 15 minutes per stock. It is a highly compressed framework compared to traditional manual parsing.
How do I handle companies that issue no formal forward guidance?
If a company refuses to provide formal quarterly or annual guidance, instruct the AI to analyze the "Management Discussion and Analysis" (MD&A) section of the report instead. The AI can analyze this text to identify internal corporate expectations based on capital expenditure trajectories and hiring patterns.