
BreakoutBulletin | BB Trading Frameworks Series
Part of the 5-Layer Trading Framework Master Guide
Educational commentary only. Not investment advice.
The Binary View Is Too Simple
Most traders learn market conditions through a two-state model: risk-on when confidence is high, risk-off when fear dominates. The framework is useful as a starting concept, but it fails to describe how markets actually behave during transitions – which is where most of the analytical work happens.
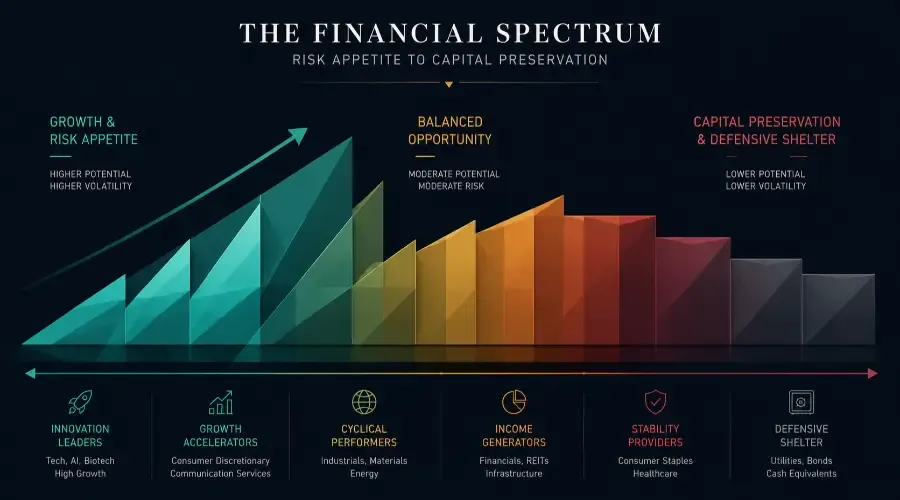
Markets do not flip between two modes. They move across a spectrum where different asset classes and sectors reflect different levels of risk appetite simultaneously. In any given week, energy stocks may be rallying on commodity demand while growth technology names face persistent selling pressure. That is not a risk-on market, nor is it a risk-off market. It is a selective environment, and treating it as either extreme produces the wrong positioning framework.
Understanding the spectrum – and where the current market sits within it – is the first layer of the 5-Layer Trading Framework and the foundation of the Market Regime Identification Framework.
The Four-State Spectrum
Rather than two states, markets operate across four identifiable conditions. Each has a distinct signal profile and a different implication for sector leadership.
| Regime | Description | Primary Signals |
|---|---|---|
| Full Risk-On | Broad participation, growth leadership, low volatility | VIX below 15, spreads compressing, 65%+ stocks above 200-DMA |
| Selective Risk-On | Capital flowing but into specific sectors only; index stable | VIX 15–20, mixed breadth, cyclical or commodity sector leadership |
| Selective Risk-Off | Caution building beneath stable-looking index | VIX 20–25, spreads beginning to widen, defensive sector outperformance |
| Full Risk-Off | Defensive leadership, rising volatility, capital preservation | VIX above 25, spreads widening sharply, broad selling with flight to Treasuries and gold |
Historically, the transitional states – Selective Risk-On and Selective Risk-Off – have provided the earliest signal for sector rotation. By the time a market reaches Full Risk-On or Full Risk-Off, much of the sector rotation has already occurred. Analysts who identify selective states early tend to anticipate sector rotation before it becomes widely recognized.
In 2026, the market has been operating in a Selective Risk-On environment for much of the first quarter. Energy and materials are attracting institutional flows. Technology and high-growth names are facing hesitation. The index is broadly stable, but participation is narrow – a hallmark of the selective regime.
Why Equity Prices Alone Are Not Enough
The most common error in regime identification is judging market conditions purely from equity index levels. Prices are the result of underlying forces, not the cause. Three signal categories lead equity movement and provide earlier regime information.
Volatility (VIX)
The VIX measures the implied volatility priced into S&P 500 options over the next 30 days. Rising VIX reflects increasing uncertainty and hedging demand. Falling VIX reflects easing fear, even when prices have not fully recovered.
| VIX Level | Regime Implication |
|---|---|
| Below 15 | Full risk-on; broad complacency |
| 15–20 | Selective risk-on; moderate confidence |
| 20–25 | Selective risk-off; caution building |
| Above 25 | Full risk-off; fear dominant |
| Above 35 | Extreme stress; historical buying opportunities on a 6–12 month horizon |
Credit Spreads
High-yield credit spreads measure the yield premium investors demand to hold corporate debt over risk-free government bonds. Tightening spreads reflect growing institutional confidence in corporate balance sheets – this signal often appears before equity markets respond.
| High-Yield Spread | Regime Signal |
|---|---|
| Below 3.0% | Strong risk-on; institutional confidence high |
| 3.0–4.0% | Neutral to selective risk-on |
| 4.0–5.0% | Selective risk-off; caution building |
| Above 5.0% | Full risk-off; credit stress |
| Above 7.0% | Historical recession territory |
Safe-Haven Asset Behaviour
Gold and government bonds rising together during equity weakness signals a genuine flight to safety – the classic full risk-off pattern. When they fail to move in sync during an equity selloff, the market is more likely experiencing liquidity-driven selling or sector rotation rather than fear-driven capital preservation. That distinction changes the analytical response entirely.
What Drives Transitions Between Regimes
Market regimes change for identifiable reasons. Understanding the drivers separates regime transitions from random price noise.
Interest rate expectations are the most consistent driver. When markets anticipate lower rates, risk appetite improves across growth and cyclical sectors. When rate expectations shift higher, long-duration assets and high-multiple growth stocks face immediate valuation pressure. The mechanism is covered in detail in Why Rising Interest Rates Hurt Growth Stocks.
Economic data surprises matter more than the data itself. Markets are forward-looking: a positive payrolls surprise in a slowing economy can trigger a shift toward risk-on behaviour even when the trend remains weak. A negative surprise in a strong economy can signal the beginning of a selective risk-off transition. How the market reacts to data – whether it holds on bad news or sells on good news – is frequently more informative than the data point itself.
Credit stress acts as an early warning. When lending conditions tighten and high-yield spreads begin widening, it reflects pressure that may not yet be visible in equity prices. Credit markets historically lead equity markets at turning points by two to six weeks.
Dollar strength adds a layer of complexity, particularly for multinational companies. A rapidly strengthening dollar can create a selective risk-off environment for global multinationals (House Slytherin in the Sorting Hat framework – companies whose earnings are heavily influenced by currency movements) even while domestic cyclicals remain in a risk-on phase.
Geopolitical shocks can push markets into risk-off conditions quickly. Recovery depends on whether the shock affects broader economic conditions or remains contained. Supply disruptions that push commodity prices higher can simultaneously create risk-off conditions in growth sectors and risk-on conditions in energy and materials.
Sector Behaviour Across Regimes
Different sectors lead in different regimes. This table summarises the typical leadership pattern across the four states.
| Regime | Leading Sectors | Lagging Sectors |
|---|---|---|
| Full Risk-On | Technology, Consumer Discretionary, Small Caps | Utilities, Consumer Staples, Gold |
| Selective Risk-On | Energy, Materials, Industrials, Financials | Defensives, long-duration growth |
| Selective Risk-Off | Healthcare, Consumer Staples, Quality large caps | Cyclicals, small caps, high-beta growth |
| Full Risk-Off | Utilities, Consumer Staples, Treasuries, Gold | Almost everything else |
This sector mapping connects directly to the four-house classification in the Sorting Hat for Stocks. Gryffindor (growth) leads in full risk-on. Ravenclaw (cyclicals) leads in selective risk-on. Hufflepuff (defensives) leads in selective and full risk-off. Slytherin (multinationals) is shaped more by dollar direction than pure risk appetite.
How to Track the Current Regime Daily
Regime identification is not a one-time assessment – it updates continuously as signals evolve. A practical daily tracking process monitors five inputs.
1. VIX level and direction – Is it rising or falling? A VIX that is rising from 18 toward 22 tells a different story than a VIX stable at 22. Direction matters as much as level.
2. High-yield credit spread direction – Available through ETF proxies: the spread between HYG (high-yield) and LQD (investment-grade) provides a daily read on credit conditions. Widening spreads are a risk-off signal regardless of where equity indices are trading.
3. Advance-decline line – Tracks how many stocks are participating in index moves. An index making new highs with a declining advance-decline line signals narrowing participation – the hallmark of transitioning from full risk-on to selective risk-on.
4. Percentage of stocks above their 200-day moving average – Above 55% supports a risk-on classification. Below 45% signals risk-off conditions. The direction of change matters as much as the current reading.
5. Safe-haven alignment – Are gold and Treasuries rising together or diverging? Alignment confirms a flight-to-safety regime. Divergence suggests something more nuanced.
The Daily Market Analysis Framework integrates these five inputs into a structured pre-market process alongside sector flow data and price action confirmation.
The Selective Environment of 2026: What the Signals Show
As of early 2026, the signal picture is consistent with a Selective Risk-On environment trending toward Selective Risk-Off.
VIX has been trading in the 18–22 range, elevated but not fear-dominant. High-yield credit spreads widened approximately 80 basis points between January and March before stabilising. The advance-decline line has been diverging from the index – the index is broadly stable but fewer stocks are participating. Energy and materials are outperforming while technology faces persistent headwinds from elevated rate expectations.
February's payrolls decline of 92,000 jobs added a recession signal that the credit market has begun pricing. If credit spreads resume widening from current levels and the advance-decline line continues deteriorating, the environment may be transitioning toward Selective Risk-Off – which would shift sector leadership further toward defensive sectors and away from cyclicals.
That transition process is what the Market Regime Identification Framework tracks in detail, including the specific thresholds at which each signal crosses from one regime classification to the next.
These signals reflect conditions as of early 2026 and should be reassessed as new data becomes available.
Common Misreads and How to Avoid Them
Misread 1: Treating a stable index as risk-on confirmation.
An index that is flat while breadth is deteriorating is not a risk-on market. It is a market where a small number of large-cap names are masking broad weakness. Check the advance-decline line before drawing any regime conclusion from index levels.
Misread 2: Calling risk-off based on a single day's VIX spike.
A single session VIX spike followed by immediate reversion is noise, not regime change. Regime transitions show persistence across multiple sessions in multiple signal categories simultaneously.
Misread 3: Assuming gold and bonds always move together in risk-off.
During liquidity stress – forced selling to meet margin calls – gold and bonds can both fall alongside equities. This happened in March 2020 and briefly in late 2022. A simultaneous decline across all asset classes signals liquidity stress, not a traditional risk-off environment, and requires a different analytical response.
Key Takeaways
| Concept | Summary |
|---|---|
| Binary framing is insufficient | Markets operate across a four-state spectrum, not two modes |
| Selective environments | Narrow participation within a broadly stable index; most common real-world condition |
| Primary signals | VIX level and direction, high-yield credit spreads, advance-decline line, % stocks above 200-DMA, safe-haven alignment |
| Regime transition timing | Credit markets and breadth lead equity prices; transitions visible before they become obvious |
| 2026 current read | Selective Risk-On trending toward Selective Risk-Off; breadth deteriorating, credit spreads widening |
| Sector mapping | Full Risk-On: Growth leads; Selective Risk-On: Cyclicals lead; Risk-Off: Defensives lead |
Go Deeper: Breakout Bulletin Trading Frameworks Series
- How to Read the Stock Market Like a Professional: The 5-Layer Trading Framework – Master guide to the full trading framework
- Market Regime Identification Framework – Classifying the current environment with specific thresholds
- Daily Market Analysis Framework – Applying regime signals in a structured daily process
- The Sorting Hat for Stocks – How macro environments map to stock groups
- Sector Rotation Strategy – How capital rotates between sectors across regime transitions
- Why Rising Interest Rates Hurt Growth Stocks – How rate expectations drive risk-on/risk-off transitions
- Defensive Stocks Explained – How Hufflepuff stocks behave in risk-off regimes
This article is published by BreakoutBulletin for educational purposes only. It does not constitute investment advice or a recommendation to buy or sell any security. Market regime signals and thresholds are provided for illustrative and educational purposes only and do not guarantee future outcomes. Past performance is not indicative of future results. BreakoutBulletin is an educational content platform and is not a registered investment advisor, broker-dealer, or financial institution.