
BreakoutBulletin | BB Macro Intelligence Series & BB Trading Frameworks Series
Connects the Sorting Hat Master Guide and the 5-Layer Trading Framework
Educational commentary only. Not investment advice.
Capital Moves Before Price Confirms It
Most traders spend their time asking which stock to buy next. The more useful question is different: where is institutional capital moving right now, and why? Tracking institutional money flow is a starting point for that analysis.
Markets are not random. They move in sequences shaped by macro forces – interest rates, inflation, and economic growth – a dynamic covered in the framework on how the stock market really works. Capital responds to these forces before price makes the move obvious. By the time a sector becomes a consensus trade, much of the institutional positioning has already occurred.
This is the core mechanism behind sector rotation. It is not a reaction to price; it is a structured response to changing macro conditions, and it connects directly to the four-house classification in the Sorting Hat for Stocks and the regime classification process in the Market Regime Identification Framework.
Why Rotation Is a Repeating Pattern, Not Noise
Sector rotation is a behavioral pattern that recurs across economic cycles. As macro conditions evolve, market leadership shifts in ways that are reasonably consistent over time, even though the specific catalysts differ each cycle.
The common error is treating markets as static – assuming today's leaders will remain tomorrow's leaders. In reality, markets are continuously transitioning between phases, and each phase has a distinct leadership profile shaped by the macro conditions driving it.
What matters for analytical purposes is not simply identifying the current phase, but understanding the mechanism behind why leadership is changing – because that mechanism determines how durable the rotation is likely to be.
Reading Rotation Through Market Participation
One of the most reliable ways to track sector rotation is observing how broad participation is across the market – not just which sector is leading, but how many sectors are confirming that leadership.
When only one or two sectors are leading while the rest lag, it typically signals an early-stage rotation. Historically, the greatest potential for capturing the full sector move has been in this early phase, before broad participation confirms the rotation. Capital is moving before the rotation becomes consensus. As more sectors begin participating, the move becomes increasingly visible, but also increasingly crowded – much of the early move has already been captured by the time broad participation confirms it.
When multiple defensive sectors begin leading together, it signals a shift from growth-seeking behavior toward capital preservation – a transition the Risk-On vs Risk-Off Markets framework tracks through VIX, credit spreads, and breadth data.
As of 2026, the prevailing pattern reflects narrow leadership. Capital has been concentrating in energy and high-dividend value names rather than spreading broadly across the market – a configuration consistent with a selective risk-off environment rather than a broad-based rally. This early-stage rotation pattern often overlaps with the hidden strength signals that appear in individual stocks before broader sector participation develops.
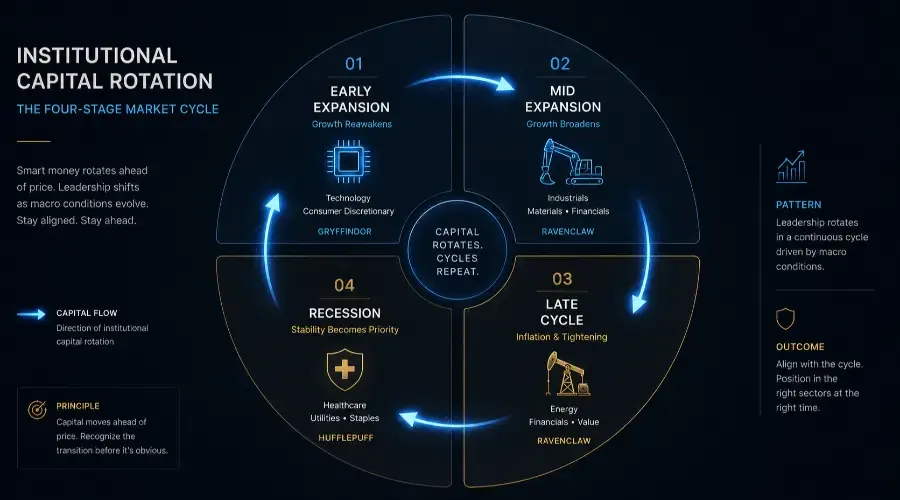
The Four Phases of Market Rotation
Early Expansion: When Growth Reawakens
This phase begins after economic stress fades and monetary conditions become supportive. Interest rates stabilize or decline, and growth expectations begin recovering.
Sectors tied to future growth tend to lead during this phase. Technology and consumer-discretionary businesses benefit most, as their valuations respond strongly to improving growth expectations and a lower discount rate environment – the mechanism explained in Why Rising Interest Rates Hurt Growth Stocks, operating in reverse.
Mid Expansion: When Growth Becomes Broad-Based
As economic momentum builds, leadership shifts and participation broadens across multiple sectors. Industrials, materials, and financials begin leading as real economic activity strengthens and capital spending accelerates.
This phase tends to be the most straightforward to identify, since growth is visible in economic data and broadly supported across sector performance.
Late Cycle: Where the Market Stands in 2026
The late-cycle phase introduces more complexity than the earlier phases. Growth remains present but is no longer accelerating. Inflation pressures build, and monetary policy tightens in response.
In 2026, this environment is clearly visible. Energy has led on elevated commodity prices – the supply-lag dynamics covered in Why Commodity Booms Lift Cyclical Stocks. Financials have benefited from higher interest rates and steeper yield curves – a topic examined in the guide on stocks that benefit from rising interest rates, while the broader yield curve mechanism is explained in Bond Yields vs Stock Market. Technology has faced pressure as higher discount rates compress long-duration valuations.
This is not a collapse in overall growth. It is a transition in leadership consistent with the late-cycle phase, where sectors benefiting from elevated rates and persistent inflation attract capital while long-duration growth sectors face structural headwinds.
Recession: When Stability Becomes the Priority
Eventually, economic pressure builds to a point where growth slows meaningfully, earnings contract, and consumer activity weakens. At this stage, defensive sectors take over – not because they grow rapidly, but because their earnings remain stable when broader earnings are declining.
Healthcare, utilities, and consumer staples typically lead this phase. The earnings stability mechanism behind this leadership is covered in detail in Defensive Stocks Explained and Best Stocks During a Recession.
The Four-Phase Rotation Map
| Phase | Leading Sectors | Macro Conditions | Sorting Hat House |
|---|---|---|---|
| Early Expansion | Technology, Consumer Discretionary | Falling rates, recovering growth | Gryffindor |
| Mid Expansion | Industrials, Materials, Financials | Broad growth, capital spending rising | Ravenclaw + Financials |
| Late Cycle | Energy, Financials, Value | Rising inflation, tightening policy | Ravenclaw |
| Recession | Healthcare, Utilities, Staples | Contracting earnings, falling demand | Hufflepuff |
Why the 2026 Rotation Is Happening
One of the defining themes of 2026 is the rotation away from high-multiple growth stocks, particularly those tied to the AI infrastructure narrative. The long-term growth thesis for these companies remains intact in most cases, but the trade itself became crowded after a multi-year run, leaving limited room for further multiple expansion.
At the same time, inflation has re-emerged as a persistent concern, shifting attention to which stocks perform best during inflationary periods, and energy prices have risen on supply-side pressures. This combination has created a leadership structure where current cash flow and pricing power carry more weight in valuation than projected future growth.
This does not represent capital permanently abandoning growth sectors. It reflects repositioning based on the macro conditions currently in place – conditions that the Market Regime Identification Framework classifies through specific signal thresholds rather than narrative alone.
These phase classifications reflect conditions as of mid-2026 and should be reassessed as macro data evolves.
Identifying Transitions Before They Become Obvious
Knowing which sectors lead in each phase has limited value on its own. The more useful skill is recognizing when the market is beginning to transition from one phase to another – before that transition is reflected in consensus positioning.
These transitions rarely happen suddenly. They typically appear through specific early signals: relative strength shifts in sector ETFs persisting across multiple sessions, changes in institutional volume patterns showing accumulation ahead of price confirmation, and movement in credit markets that historically precedes equity market reactions by several weeks.
The Stocks Rising While Market Falls framework documents this accumulation pattern in detail through a three-stage process: volume appearing before price moves, support holding while the broader market weakens, and price eventually confirming what volume signals had already indicated.
Q&A: Sector Rotation in Practice
Why is capital rotating out of technology despite strong long-term AI-related growth themes?
Markets price in expectations, not just narratives. The AI-driven growth trade became crowded after sustained outperformance, and rising interest rates increased the cost of discounting future earnings. As inflation pressures build, capital has shifted toward sectors generating current cash flow, such as energy and value-oriented businesses, rather than sectors priced primarily on distant earnings growth.
What does narrow leadership concentrated in energy and defensive sectors signal?
It is consistent with a selective risk-off environment, where institutions are not broadly exiting equities but are concentrating capital in specific sectors while remaining cautious about the broader macro outlook. This pattern is covered in detail in the Risk-On vs Risk-Off Markets framework.
Is value likely to remain the dominant theme through the rest of 2026?
Value and cash-flow-oriented sectors have been favored within the current late-cycle phase. Market leadership is cyclical rather than permanent – growth sectors have historically regained leadership once monetary policy eases and interest rates decline. Until that shift occurs, the prevailing conditions continue to favor sectors aligned with the late-cycle profile.
How This Connects to the Daily Process
Sector rotation analysis is not a standalone exercise. It is Step 3 of the Daily Market Analysis Framework – the step that sits between regime classification (Step 1), internals confirmation (Step 2), and individual stock selection (Step 4).
Identifying the current rotation phase requires the macro regime to be classified first. A late-cycle classification with rising rates and persistent inflation points toward energy, financials, and value. A recession classification points toward healthcare, utilities, and staples. Without the regime context established first, sector rotation analysis risks chasing whichever sector has recently outperformed rather than identifying the macro mechanism driving genuine leadership.
Key Takeaways
| Concept | Summary |
|---|---|
| Core principle | Capital rotates ahead of price; by the time a sector is consensus, the move has often occurred |
| Participation signal | Narrow leadership (1-2 sectors) signals early-stage rotation; broad participation signals later stages |
| Four phases | Early Expansion → Mid Expansion → Late Cycle → Recession |
| 2026 phase | Late Cycle – Energy and Financials leading; Technology facing rate-driven headwinds |
| Transition signals | Relative strength persistence, volume accumulation, credit market movement |
| Daily integration | Step 3 of the Daily Market Analysis Framework, dependent on Step 1 regime classification |
Go Deeper: Breakout Bulletin Macro Intelligence & Trading Frameworks Series
- The Sorting Hat for Stocks – Master guide to the four macro stock houses
- How to Read the Stock Market Like a Professional: The 5-Layer Framework – Master guide to the full trading framework
- Market Regime Identification Framework – Classifying the macro environment that determines rotation phase
- Daily Market Analysis Framework – Step 3: applying rotation analysis in the daily process
- How the Stock Market Really Works Framework – Understand the complete market structure before analyzing sectors
- Institutional Money Flow – Learn how professional capital moves before price confirms the trend
- Best Stocks During Inflation (2026 Guide) – Which sectors historically outperform during persistent inflation
- Stocks That Benefit From Rising Interest Rates (2026) – Why banks, insurers, and value sectors can outperform during higher-rate environments
- Why Rising Interest Rates Hurt Growth Stocks – The mechanism behind Early Expansion leadership
- Why Commodity Booms Lift Cyclical Stocks – The mechanism behind Late Cycle energy leadership
This article is published by BreakoutBulletin for educational purposes only. It does not constitute investment advice or a recommendation to buy or sell any security. All sector and phase classifications are provided for illustrative and educational purposes only. Past performance is not indicative of future results. BreakoutBulletin is an educational content platform and is not a registered investment advisor, broker-dealer, or financial institution.