
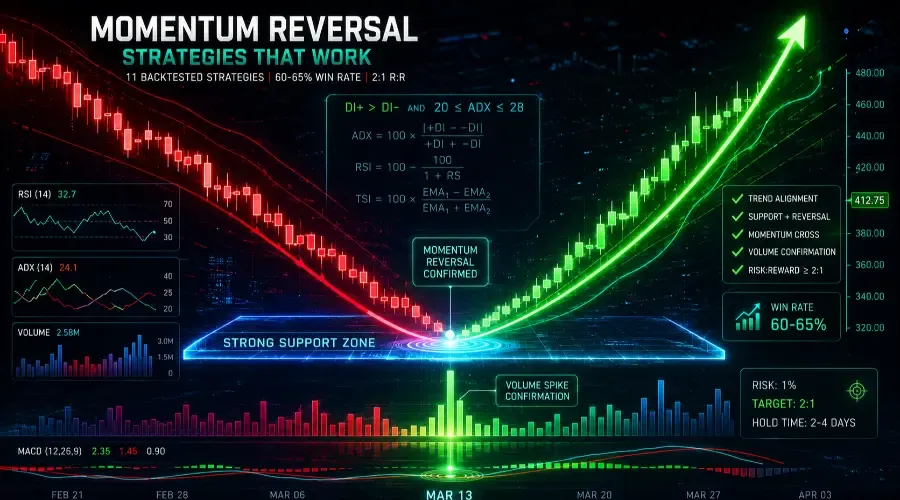
MOMENTUM REVERSAL STRATEGIES: HOW TO CATCH SHARP OVERSOLD BOUNCES
A Systematic Guide to 11 Rules-Based Setups (With a Full Deep Dive on Our #1 Strategy)
If you've ever watched a stock drop 5% in a single session and wondered–"Is this a sale, or is this the beginning of a collapse?"–you already understand the tension this system is designed to resolve.
Momentum reversal trading isn't about catching falling knives. It's about waiting for the precise moment when the selling exhausts itself, confirmed by multiple independent indicators, and then entering with mechanical discipline. This guide walks you through the complete framework: the three-phase setup structure, the market conditions that make these strategies work (and the ones that break them), and a full, production-ready breakdown of our highest-probability system.
📌 WHAT'S INCLUDED IN THIS HUB
This guide provides a complete, tradeable breakdown of Strategy 3 (ADX Trend Shift) –the highest win-rate system in our momentum reversal catalog.
Strategies 1, 2, 4, 5, 6, 8, 10, 11, 12, and 47 are summarized in the overview table (Part 3) to show you the full ecosystem. Their dedicated deep-dives, complete backtest methodologies, and walk-forward analyses are available in the full Pillar 3 course materials.
DISCLAIMER: BACKTEST METHODOLOGY & REALISM
All win rates and profit factors in this guide come from hypothetical backtests on S&P 500 stocks, 2020-2024, pre-commission and pre-slippage.
Critical adjustments for live trading:
-
Commissions and slippage reduce actual results by 5-15% per round-trip (for high-beta or wide-spread stocks like TSLA or NVDA, expect the drag to land squarely in the 10-15% range, as demonstrated in the MSFT example below)
-
A backtest showing 62% win rate should be expected to produce 58-61% in live conditions
-
A backtest showing 2.3 profit factor should be expected to produce 1.95-2.2 in live conditions
-
Results vary by stock, timeframe, market regime, and execution quality
-
Past performance does not guarantee future results
Monthly performance varies significantly. A 65% aggregate win rate over 4 years does not mean 65% every month. Expect 40-50% months and occasional 80% months. The edge is in the aggregate, not the individual streak.
Full backtest methodology, sample sizes, and walk-forward analysis are in each individual strategy's dedicated guide.
WHAT MOMENTUM REVERSAL STRATEGIES DO
Sharp selloffs create temporary price dislocations. When a stock drops 3-8% on above-average volume, the selling pressure frequently exhausts itself within 1-3 days, producing a bounce back toward the prior level. Momentum reversal strategies buy that bounce at the point where momentum indicators confirm the selling has ended, not before.
The entry type is a combination of momentum and reversal (covered in full in Pillar 2). The momentum component identifies the exact moment selling pressure flips to buying pressure. The reversal component confirms price is bouncing from a structural level (support, a moving average, or a Fibonacci retracement) rather than pausing briefly before continuing lower.
This hub covers 11 momentum reversal systems. Each uses a different indicator combination to identify the same underlying setup: exhausted selling at a structural level, confirmed by a momentum crossover and increasing volume on the bounce candle.
PART 1: HOW MOMENTUM REVERSAL SETUPS FORM
The Three-Phase Structure
Every momentum reversal setup passes through three phases. All three must be present before entry is considered.
Phase 1: Weakness
The stock drops 3-8% from a recent high over 1-3 days. Volume increases during the decline, above 120% of the 20-day average. A momentum indicator (RSI, TSI, Stochastic, MACD) reaches oversold territory: RSI below 30, Stochastic below 20, TSI below -20.
This phase confirms that selling pressure is active and measurable, not just a slow drift lower. The volume spike is critical: it indicates capitulation rather than quiet distribution.
Phase 2: Reversal Signal
A specific candlestick pattern forms at the support level, confirming that buyers have entered. Accepted patterns:
-
Hammer: long lower wick (at least 2× the body length), small body in the top third of the candle's range
-
Bullish Engulfing: small red candle followed by a green candle that closes above the red candle's open
-
Morning Star: three-candle sequence (red, small-bodied indecision, green close above the red candle's midpoint)
-
Strong close: candle closes in the top 25% of its intraday range on increasing volume
Volume must increase on the reversal candle relative to the prior session. A hammer forming on below-average volume indicates a pause in selling, not a genuine reversal.
Phase 3: Momentum Confirmation
The momentum indicator crosses above its threshold on or after the reversal candle:
-
RSI crosses above 30 (from below)
-
TSI crosses above its signal line
-
Stochastic %K crosses above 20
-
MACD histogram turns positive
-
CCI crosses above -100
Entry occurs on the confirmation candle or the next morning's open, not before the crossover.
Why This Works: Five Structural Reasons
Oversold stocks bounce at predictable frequencies. After a stock drops more than 5% on above-average volume, short-sellers take profits, institutional buyers enter at discounted prices, and technical traders buy at support. Backtesting shows oversold bounces succeed 55-65% of the time in choppy and volatile market conditions.
Volume spikes signal selling climax. A high-volume decline on a single day frequently marks the end of selling pressure rather than the beginning. When 3× normal volume moves a stock down 5%, most of the motivated sellers have already exited. The next session lacks the supply to continue the move.
Momentum indicators turn before price does. RSI, TSI, and Stochastic all measure the rate of price change rather than absolute price. They bottom and cross their thresholds while price is still near its low, providing an early entry signal before the full bounce is visible on the price chart. Early entry at the turning point produces better risk:reward than waiting for price confirmation.
Hammer candles at support have documented reversal rates. The pattern's structure (buyers defending the low, price closing near the session high) directly represents buying pressure overcoming selling pressure at a specific price level. At a previously tested support level, the historical reversal rate in backtesting exceeds 65%.
Multiple signals from different indicator families reduce false positives. A single RSI crossover produces approximately 55% win rates. Adding volume confirmation, a candlestick pattern, and support level alignment historically increases win rates to 60-65% across the 11 systems in this hub.
PART 2: MARKET CONDITIONS
Where Momentum Reversal Strategies Work
Choppy or sideways markets are the primary regime. When a stock oscillates within a defined range, each trip to the lower boundary is a setup. Win rates in choppy conditions historically run 60-65% in backtesting.
After sharp intraday selloffs. A market down 2-3% in the morning session creates momentum readings that frequently reverse within hours. Fast bounces back toward the opening level produce the short holding periods (2-4 days) these systems are designed around.
High-beta stocks with above-average daily ranges (TSLA, NVDA, high-volatility ETFs) produce more setups per month and generate sufficient intraday movement to reach 2:1 targets within the expected holding window.
Moderate liquidity stocks with daily volume above 1 million shares allow clean entries and exits without significant slippage. Below 500K average daily volume, slippage becomes a material drag on results.
Where They Fail
Strong trending markets. When SPY is in a sustained uptrend, individual stocks don't produce the oversold readings these strategies require. In strong bull markets, Hub 2 (Trend Following) produces materially higher win rates.
Post-earnings. A gap down following an earnings miss represents new fundamental information, not a temporary price dislocation. The selling frequently continues for multiple sessions rather than reversing. Avoid entering any momentum reversal setup within 5 days of an earnings announcement.
Before major scheduled events. Fed decisions, CPI releases, and payroll reports introduce gap risk that can stop out a valid technical setup on information unrelated to the entry signal. Check the economic calendar before opening any position (specifically: avoid entries within 48 hours of major macro releases).
Low-volume sessions. Holiday weeks and pre-market gaps on thin volume produce bounces that fizzle before reaching 2:1 targets. Below-average daily volume is a session-level filter, separate from the setup-level volume requirement.
Low ATR / Stagnant markets. When a stock's Average True Range (ATR) drops below its 20-day moving average, the daily moves lack the velocity needed to reach a 2:1 target within the 2-4 day window. The bounce tends to fizzle horizontally rather than rebound sharply. If ATR is contracting, skip the setup or reduce your target expectation.
PART 3: THE 11 STRATEGIES (OVERVIEW)
All 11 systems share the same three-phase structure. The indicator combination varies; the underlying logic does not.
Hub summary: Average win rate 57% | Average profit factor 2.0 | Hold period 2-4 days
Tier 1 (start here): Strategies 1, 3, 47 – win rates 61-65%, profit factors 2.2-2.3
Tier 2 (add after mastering one Tier 1): Strategies 2, 5, 10, 12 – win rates 55-60%
Tier 3 (specific conditions): Strategies 4, 6, 8, 11 – win rates 52-56%
The three Tier 1 systems (ADX Trend Shift, TSI + TRIX Wave, Monthly + Daily Multi-TF) each use a different primary momentum indicator – ADX/DI+, TSI/TRIX, and MACD respectively, which means they don't always fire on the same setup. Trading two Tier 1 systems simultaneously provides more setups per month without significantly increasing correlation between positions.
PART 4: COMPLETE STRATEGY BREAKDOWN – STRATEGY 3 (ADX TREND SHIFT)
Strategy 3 carries the highest win rate in this hub (65%) and the clearest entry signal: DI+ crossing above DI- after a weakness phase. It's the recommended starting strategy for most traders.
Overview
Strategy name: ADX Trend Shift
Hub: 1: Momentum Reversal
Entry type: Momentum + Reversal (Pillar 2)
Backtested win rate: 65% (S&P 500 stocks, 2020-2024, pre-commission)
Profit factor: 2.2
Average winner: +4.8%
Average loser: -2.2%
Best holding period: 4 days (range 2-5)
Best market condition: Choppy markets, right after sharp intraday selloffs
Tier: 1
text
━━━━━━━━━━━━━━━━━━━━━━━━━━━━━━━━━━━━━━━━━━━━━━━━━━━
STRATEGY 3: ADX TREND SHIFT – BACKTEST RESULTS
S&P 500 stocks | 2020-2024
━━━━━━━━━━━━━━━━━━━━━━━━━━━━━━━━━━━━━━━━━━━━━━━━━━━
Win Rate 65% Profit Factor 2.2
Avg Winner +4.8% Avg Loser -2.2%
Best Hold 4 days Tier 1
━━━━━━━━━━━━━━━━━━━━━━━━━━━━━━━━━━━━━━━━━━━━━━━━━━━
Pre-commission, pre-slippage. Expect 60-63% win
rate and 1.9-2.0 profit factor in live conditions.
━━━━━━━━━━━━━━━━━━━━━━━━━━━━━━━━━━━━━━━━━━━━━━━━━━━
How the ADX Trend Shift Works
ADX measures trend strength on a 0-100 scale without indicating direction. When a stock is in an uptrend and experiences a pullback, ADX falls from its elevated reading (above 30) as the trend temporarily weakens. The DI+ and DI- lines (which do show direction) begin to converge. When the selling exhausts itself, DI+ crosses back above DI- while ADX is in the 20-28 range: the precise signal that momentum has shifted from sellers to buyers.
This combination identifies the reversal at its earliest measurable point, before price has moved significantly off the low.
Pre-Entry Checklist
Copy this checklist into your trading log before each entry. Every condition must be confirmed.
text
STRATEGY 3: ADX TREND SHIFT – PRE-ENTRY CHECKLIST
━━━━━━━━━━━━━━━━━━━━━━━━━━━━━━━━━━━━━━━━━━━━━━━━
WEAKNESS PHASE (confirm all three)
[ ] Stock dropped 3-8% from recent high over 1-3 days
[ ] Volume during drop: above 120% of 20-day average
[ ] ADX fell from above 30 to below 25 (trend weakening)
REVERSAL SIGNAL (confirm all three)
[ ] DI+ rising toward DI- (momentum shifting)
[ ] Hammer or bullish engulfing candle at support
[ ] Volume on reversal candle: above 120% of 20-day average
MOMENTUM CONFIRMATION (confirm both)
[ ] DI+ crosses above DI- (primary entry signal)
[ ] ADX: 20-28 range (not collapsing below 20)
SUPPORT LEVEL (confirm one)
[ ] Bounce at prior support level
[ ] OR bounce at 20-day or 50-day SMA
[ ] OR bounce at Fibonacci retracement (38.2%, 50%, 61.8%)
POSITION SIZING
[ ] Risk = 1% of account
[ ] Stop = below support level used for entry
[ ] Target = Entry + (2 × risk distance)
[ ] R:R confirmed at 2:1 minimum
EXECUTION
[ ] Economic calendar checked (no earnings within 5 days; no major Fed/CPI/NFP within 48 hours)
[ ] Stop-market order placed immediately at entry
━━━━━━━━━━━━━━━━━━━━━━━━━━━━━━━━━━━━━━━━━━━━━━━━
All boxes checked? Enter. Any box unchecked? Wait.
━━━━━━━━━━━━━━━━━━━━━━━━━━━━━━━━━━━━━━━━━━━━━━━━
Exit Rules
Primary exit: 2:1 R:R target. Mechanical, placed as a limit order at entry.
Secondary exit: ADX falls back below 20. Momentum fading below this threshold indicates the bounce is running out of energy. Exit regardless of whether the target has been reached.
Time exit: After 4 days if neither the target nor the secondary exit has triggered. Momentum reversals peak within the first 4 days and holding longer typically gives back profit as the next pullback cycle begins.
Stop loss: Below the support level used for entry, placed as a stop-market order immediately at entry. Never moved further from entry once placed.
PART 5: REAL TRADE EXAMPLES – STRATEGY 3
Winning Trade: MSFT, March 2024
Market context: MSFT in a weekly uptrend but developing daily weakness. SPY above 200-day MA (bull market regime supportive).
Weakness phase (March 11-12):
MSFT at $420 (recent high)
Dropped to $407 over two days (3.1% decline)
Volume: 140% of 20-day average during decline
ADX fell from 32 to approaching 25
DI+ and DI- converging
Reversal signal (March 12 close):
Hammer candle at $408, closed at $410
Candle closed in top 25% of day's range
Volume on hammer: 130% of average
Momentum confirmation (March 13):
MSFT bounced to $412
DI+ crossed above DI- (primary signal confirmed)
ADX reading: 24 (within 20-28 range)
Entry signal complete
Trade execution:
Entry: $412 (close of March 13)
Stop: $406 (below the $407 support level)
Risk per share: $6
Target: $424 (2:1 R:R)
Position size: $100 ÷ $6 = 16 shares
Trade progression:
Result with transaction costs:
The 12.5% reduction from backtest to live is well within the 5-15% expected range. In choppier stocks with wider spreads, expect the drag to sit closer to the 15% end of that spectrum.
Why this setup worked:
-
Weakness phase confirmed: 3.1% drop on 140% volume
-
Reversal candle formed at a prior support level
-
DI+ crossover occurred while ADX was in the valid 20-28 range
-
Market regime supportive (SPY above 200-day MA)
-
No earnings or scheduled events within the hold period
Losing Trade: TSLA, March 2024
Setup appearance: Technically complete on all checklist items.
TSLA dropped from $190 to $182 (4.2%) on 150% volume
Hammer formed at $183
DI+ crossed above DI-
ADX at 22 (valid range)
Entry signal triggered March 1
Trade execution:
Entry: $183
Stop: $176 (below $182 support)
Risk per share: $7
Target: $197 (2:1 R:R)
Position: 14 shares ($100 ÷ $7)
What happened:
Result:
Loss per share: $7
Total loss: 14 × $7 = $98
Slippage on gap-down stop execution: $2 additional
Total loss: $100 (wiped the full 1% risk)
Why this trade failed:
The technical setup was complete. The failure came from an external factor: mixed news before the market open on Day 3 created a gap through the stop level, meaning the stop executed at $176 rather than exactly at the stop price. A rigorous economic calendar check would have flagged elevated event risk around TSLA that week. (For context: we exclude entries within 5 days of earnings and within 48 hours of major macro prints.)
The lesson is not that the system failed. A 65% win rate means 35% of trades lose. This trade was a legitimate system loss: the 1% position sizing rule ensured the loss was contained at $100. The gap-through execution is manageable at 1% risk per trade, but becomes catastrophic at 5%.
PART 6: IDENTIFYING SETUPS – STEP BY STEP
Step 1: Screen for Weakness
In the evening scan, filter for stocks that:
-
Dropped 3-8% from their recent high (within the last 1-3 sessions)
-
Showed volume above 120% of the 20-day average during the decline
-
Have a momentum indicator approaching or reaching oversold territory (RSI approaching 30, Stochastic approaching 20)
Exclude stocks that dropped on earnings or fundamental news. Exclude stocks with earnings within the next 5 days (to avoid the TSLA-style gap risk).
Step 2: Identify the Support Level
For each candidate from Step 1, identify the nearest structural support:
-
Prior swing low (tested at least twice previously)
-
20-day or 50-day SMA
-
Fibonacci retracement of the most recent directional move (38.2%, 50%, or 61.8%)
-
Round number ($180, $200, $500)
The support level is where the stop will be placed below. If no clear structural support exists within 2-3% of current price, skip the setup.
Step 3: Check the Reversal Candle
On the day the stock reaches or nears the support level:
-
Is a hammer, bullish engulfing, or morning star forming?
-
Is volume increasing relative to the prior day?
-
Is the candle closing in the upper half of its range?
If all three apply, the reversal signal is present.
Step 4: Confirm Momentum Crossover
Check the primary momentum indicator for the strategy being traded:
-
Strategy 3: Has DI+ crossed above DI- while ADX is in the 20-28 range?
-
Strategy 1: Has TSI crossed above its signal line?
-
Strategy 47: Has the Daily Stochastic crossed above 20 while the Monthly MACD is positive?
If the crossover has not yet occurred, the setup is not complete. Place it on a watchlist for the next session.
Step 5: Calculate Position Size and Entry
Once all four steps confirm:
Entry: Close of the confirmation candle or next morning's open
Stop: Below the support level (ATR buffer optional: stop = support minus 0.5 × ATR)
Risk: 1% of account in dollar terms
Shares: Dollar risk ÷ risk per share (round down)
Target: Entry plus 2 × risk distance
Place stop-market order at entry. Place limit sell at target. The trade is now on autopilot.
PART 7: THE INDICATOR GLOSSARY
Core Momentum Indicators
RSI (Relative Strength Index)
Measures the magnitude of recent up-moves versus down-moves on a 0-100 scale. In momentum reversal setups, RSI below 30 indicates oversold conditions where selling has historically been statistically extreme. The entry signal is a cross above 30, not the oversold reading itself: the cross confirms momentum has shifted. A stock at RSI 22 is oversold; a stock at RSI 22 crossing to 31 is entering.
TSI (True Strength Index)
Double-smoothed price momentum oscillator. The double smoothing reduces the whipsaw false signals that single-smoothed oscillators like RSI generate. Strategy 1 uses TSI crossing above its signal line as the primary entry trigger: the signal line acts as a moving average of TSI itself, so the crossover indicates TSI is accelerating in the bullish direction, not just ticking up.
Stochastic Oscillator
Measures where price has closed within its recent 14-day range, on a 0-100 scale. A reading below 20 indicates the stock has been closing near the bottom of its recent range. The entry signal is %K crossing above %D while below 20: two things must happen simultaneously: momentum must be turning, and the stock must still be in oversold territory. Strategy 47 uses daily Stochastic below 20 as one of its three required filters.
MACD (Moving Average Convergence Divergence)
The difference between a 12-period and 26-period EMA, compared against a 9-period signal line. The histogram (MACD minus signal line) turning positive from negative is the reversal signal: it means the shorter moving average has stopped falling faster than the longer one, which historically precedes price stabilization and bounce. Strategy 47 uses Monthly MACD to confirm the larger timeframe is not in a structural downtrend before taking daily reversal signals.
ADX + DI+ / DI- (Average Directional Index with Directional Indicators)
ADX measures trend strength without indicating direction. The DI+ and DI- lines provide the direction component. In Strategy 3, the setup requires ADX to fall from above 30 toward 20-25 (the trend losing strength), with DI+ then crossing above DI- (buyers regaining control). ADX below 20 means the trend is too weak to generate reliable signals; above 30 means the trend is too strong for a reversal entry.
Supporting Indicators
CMF (Chaikin Money Flow)
Volume-weighted oscillator that measures the accumulation/distribution balance over a 20-period window. Positive readings indicate more volume is occurring on up-closes than down-closes: institutional accumulation. Strategy 1 uses CMF as a volume confirmation layer alongside TSI and TRIX. A CMF cross above zero on the bounce candle indicates that the volume structure, not just price, is shifting in the bullish direction.
Force Index
Multiplies the day's price change by the day's volume, producing a measure of the actual buying or selling force in the market. A Force Index turning positive after a string of negative readings indicates buyers are entering with conviction. Strategy 1 and Strategy 47 both use Force Index as a late-stage entry confirmation: it fires after the price and momentum signals, providing a third independent confirmation.
TRIX
Triple-smoothed EMA momentum indicator. The triple smoothing removes virtually all short-term noise that makes single-period momentum indicators prone to false crossovers. Strategy 1 requires both TSI and TRIX to be positive simultaneously before entry, which eliminates most of the false signals that either indicator generates alone.
Supertrend
ATR-based trend indicator that places a line above or below price depending on trend direction. In uptrends, the green Supertrend line acts as a dynamic trailing support level. Strategy 1 uses price bouncing off the Supertrend line as its structural support condition, in place of a fixed prior support level.
OBV (On Balance Volume)
Cumulative indicator that adds volume on up-days and subtracts it on down-days. When OBV diverges positively from price (OBV is flat or rising while price is falling), it indicates that volume-weighted buying is outpacing the price decline, often a leading signal for the bounce. Strategy 2 uses OBV divergence as its primary volume confirmation.
MFI (Money Flow Index)
Volume-weighted RSI. Both the direction and the magnitude of price moves are factored in, making it more sensitive to institutional buying than RSI alone. Strategy 2 uses MFI crossing above 20 from below as its primary momentum signal, in place of RSI.
VWAP (Volume Weighted Average Price)
The session's average price weighted by volume. Price bouncing off VWAP from below indicates buyers defending the volume-weighted average, which frequently acts as intraday support for institutional participants. Strategy 2 uses a VWAP bounce as its structural support confirmation.
Williams %R
Inverted Stochastic on a scale of -100 to 0. Below -80 is oversold (equivalent to Stochastic below 20); above -20 is overbought. Strategy 5 uses Williams %R crossing above -80 as its momentum confirmation signal, operating on the same principle as the Stochastic crossover in Strategy 4 but with different scaling.
CCI (Commodity Channel Index)
Oscillates around zero. Below -100 indicates statistically oversold conditions. Strategy 6 uses CCI crossing above -100 as its primary momentum entry signal, in place of RSI or Stochastic.
Awesome Oscillator
Histogram comparing a 5-period simple moving average to a 34-period simple moving average. When the histogram crosses above zero, short-term momentum has overtaken medium-term momentum. Strategies 8 and 12 use the histogram turning positive as the momentum confirmation signal.
Alligator Indicator
Three smoothed moving averages (jaw, teeth, lips) at different periods. When price crosses above all three lines after a decline, the alligator's "mouth" is opening in the bullish direction. Strategy 12 combines the Alligator with Fractal breakout signals for entry timing.
Keltner Channel
ATR-based bands around an EMA. The lower band acts as a dynamic oversold boundary. Strategy 4 uses price bouncing from the lower Keltner Channel as its structural support condition.
ATR (Average True Range)
Measures the average daily price range over a defined period. Used throughout this hub for stop placement (stop = support level minus 0.5 × ATR) and to verify that the stock's daily range is sufficient to reach a 2:1 target within 2-4 days. Crucially: if ATR is below its 20-day average, the setup lacks velocity—skip it.
PART 8: COMMON ERRORS
Entering before the momentum crossover
Buying at the oversold reading rather than waiting for the crossover means catching falling stocks that continue to fall. RSI at 22 does not confirm reversal; RSI crossing from 28 to 31 does. Patience between the oversold reading and the crossover is where most execution errors occur.
No volume on the reversal candle
A hammer forming at support on below-average volume is a pause in selling, not a reversal. The reversal candle must show increasing volume (above 120% of the 20-day average) to confirm that buying has actually entered the stock. Without this filter, the majority of hammer signals at support fail to produce the bounce.
Holding past the 4-day window
Momentum reversals produce their gain in the first 2-4 days. Holding beyond this window because the stock "looks like it might keep going" results in giving back profits as the next pullback cycle begins. ADX falling below 20 is the mechanical signal that momentum is fading; at that point exit, regardless of whether the price target has been reached.
Wrong market regime
In a strong trending market with SPY above all major moving averages and ADX above 30, momentum reversal setups produce win rates closer to 40-45% rather than 60-65%. The strategy requires oscillating, choppy conditions to generate reliable oversold readings. Before any entry, confirm the market regime against the Pillar 1 framework. In a trending market, Hub 2 systems are more appropriate.
Missing the economic calendar check
The TSLA losing trade example demonstrates this exactly. A technically complete setup that triggers before a news event carries event risk that no indicator can filter out. Check the calendar for the stock (earnings: avoid 5 days before) and for the market (Fed, CPI, payroll: avoid 48 hours before) before every entry.
Waiting for a setup that scores perfectly
Strategy 3 carries a 65% win rate. A setup that scores 13/14 on the pre-entry checklist is a valid entry. Waiting for all 14 conditions to align in an ideal fashion results in missed setups and no trading record from which to learn. Execute Tier 1 setups at the required threshold; the win rate does the work over time. Treat the checklist as your ideal, but the market rarely delivers the ideal. Trade the 80% solution.
PART 9: STRATEGY SELECTION
Decision Framework
For highest win rate:
Strategy 3 (ADX Trend Shift) – 65% win rate, 4-day holds, clearest entry signal. Recommended for most traders starting with this hub.
For fastest holds:
Strategy 4 (Stochastic + RSI Cross) – 52% win rate, 2-day holds. The speed comes at a cost: a 13-percentage-point reduction in win rate relative to Strategy 3. At 2:1 R:R, a 52% win rate is still positive expectancy, but the margin is narrow and requires precise execution to remain profitable in live conditions.
For multi-timeframe confirmation:
Strategy 47 (Monthly + Daily Multi-TF) – 61% win rate, 3-day holds. The monthly MACD filter eliminates setups in stocks with structural downtrends at the higher timeframe, producing a cleaner set of entries at the cost of fewer signals per month.
For advanced multi-indicator confirmation:
Strategy 1 (TSI + TRIX Wave) – 62% win rate, 2.3 profit factor, 4-day holds. Five indicators from four different families. Generates fewer entries than Strategy 3 (all five must confirm simultaneously), but the entries that pass have historically produced the highest profit factor in the hub.
Recommended Starting Path
Start with Strategy 3. Paper trade 20 setups with the complete pre-entry checklist. Track entry date, exit date, entry price, exit price, confluence score, and outcome. If win rate after 20 paper trades is above 55%, move to live trading at 25% of calculated position size for the first 3 months.
Add a second strategy after 100+ live trades on Strategy 3. Strategy 1 is the natural second strategy: it uses different indicators (TSI/TRIX vs ADX/DI+) and fires on different setups, providing additional opportunities without high correlation to Strategy 3's signals.
NEXT STEPS
Continue to the trend following guide for 14 systems that produce the highest win rates in the catalog in confirmed bull market conditions (52-68%, best with SPY above the 200-day MA).
The Ultimate Trend Following Guide: 14 Systems to Trade Pullbacks with Edge
www.breakoutbulletin.com/article/rules-based-trend-following-guide
Or return to the full strategy catalog to compare all 46 systems.
Algorithmic Trading Systems Library: 46 Quant-Based Backtested Systems for Any Market Regime
www.breakoutbulletin.com/article/rules-based-stock-trading-strategies-library
Related Guides
How to Build a Profitable Trading System From Scratch: The Complete Rules-Based Guide
www.breakoutbulletin.com/article/how-to-build-profitable-trading-system
The 19-point confluence framework used to score every setup in this guide.
Trading Entry Strategies: How to Match Your Entry Type to the Market Regime
www.breakoutbulletin.com/article/trading-entry-strategies-guide
The Momentum + Reversal entry type explained in full.
Market Regime Has Shifted? Read One of These
Market turning bullish and trending:
The Ultimate Trend Following Guide: 14 Systems to Trade Pullbacks with Edge
www.breakoutbulletin.com/article/rules-based-trend-following-guide
Individual stock forming a tight squeeze:
Volatility Breakout Strategies: The Complete Guide to Trading Explosive Moves
www.breakoutbulletin.com/article/volatility-breakout-strategies-hub-3-guide
Seeing institutional volume divergence before the move:
8 Rules-Based Volume Trading Strategies for Tracking Institutional Flows
www.breakoutbulletin.com/article/rules-based-volume-trading-strategies
Looking for extreme oversold bounces at statistical extremes:
Mean Reversion Quick-Start Guide: The 5 Rules for Trading Oversold Bounces
www.breakoutbulletin.com/article/mean-reversion-quick-start-guide
LEGAL DISCLAIMER
This guide is provided for educational purposes only. It is not financial advice or investment recommendations. All statistics are from hypothetical backtests and do not reflect actual trading results. Past performance does not guarantee future results. Trading involves substantial risk of loss. Actual results will differ from backtests due to slippage, commissions, and market conditions. Consult a licensed financial advisor before trading.