
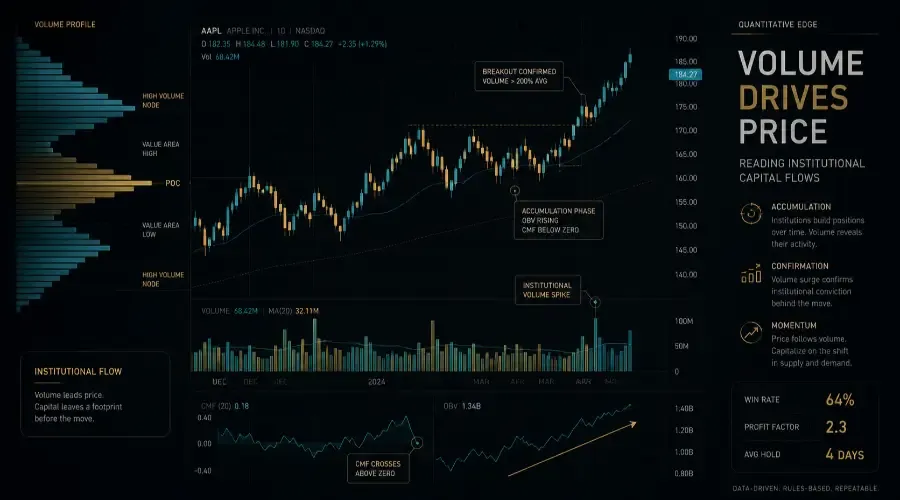
8 Rules-Based Systems for Reading Institutional Capital Flows
DISCLAIMER: BACKTEST METHODOLOGY
All win rates and profit factors in this guide come from hypothetical backtests on S&P 500 stocks with above 2 million average daily volume, 2020-2024, pre-commission and pre-slippage.
Critical adjustments for live trading:
-
Commissions and slippage reduce actual results by 6-8% per round-trip
-
A backtest showing 64% win rate should be expected to produce 58-61% in live conditions
-
A backtest showing 2.3 profit factor should be expected to produce 1.9-2.1 in live conditions
-
Win rates on stocks with below 2 million average daily volume drop to 40-50%: institutional signals require institutional liquidity
-
Volume indicators produce false signals after stock splits, secondary offerings, dividend events, and acquisition rumors: always check the news calendar before entering
-
Past performance does not guarantee future results
Full backtest methodology, sample sizes, and walk-forward analysis are in each individual strategy's dedicated guide.
Volume standard for this hub: A reading of 200%+ relative to the 20-day average is the required threshold on the entry signal candle. 120%+ is the minimum for accumulation-phase up-days. Below 2 million average daily shares on the stock itself, volume indicator signals are statistically unreliable regardless of percentage readings.
WHAT THIS GUIDE COVERS
This hub covers 8 volume trading systems. Strategy 40 (CMF Zero Cross) is fully detailed here with complete entry rules, the exact screening logic (included below), a copy-pasteable checklist, and real trade examples. The remaining 7 strategies are introduced with their indicator combinations, win rates, and tier classifications. Full breakdowns for each—including complete backtest methodology, walk-forward analysis, and live trading examples—are in their individual strategy guides.
WHAT VOLUME TRADING STRATEGIES DO
Volume trading strategies identify when institutional capital is accumulating in a stock before price reflects that accumulation. The underlying observation is straightforward: institutional orders are large enough to leave measurable traces in volume data before price moves. When the volume pattern shows consistent buying pressure (rising On Balance Volume, positive Chaikin Money Flow, volume clustering at specific price levels) while price is still consolidating, the subsequent price move tends to follow.
This is distinct from the other four hubs. Trend following (Hub 2) enters after a trend is already established. Volatility breakout (Hub 3) enters on the price move itself. Volume trading identifies the accumulation phase before the price move is visible in traditional indicators – the entry is earlier in the sequence, at the cost of more interpretation required to read the volume signals correctly.
The entry type is Momentum + Volume (covered in full in Pillar 2). Volume provides the institutional confirmation; momentum indicators confirm the timing of the entry within that accumulation phase.
Hub 4 produces the most regime-neutral results in the catalog. Unlike Hub 2 (which requires a bull market) or Hub 3 (which requires prior consolidation), institutional accumulation occurs in all market regimes. The strategies in this hub are applicable in bull, bear, and sideways markets – with the important caveat that the specific signal type shifts by regime, as described in Part 2.
PART 1: HOW VOLUME TRADING SETUPS FORM
The Four-Phase Structure
Phase 1: Accumulation
Institutional buying leaves a measurable volume pattern over 5-10 days:
-
Volume above 120% of the 20-day average on up-days (positive closes)
-
Volume below 80% of the 20-day average on down-days (negative closes)
-
The asymmetry between up-day and down-day volume is the signal: more shares change hands on days the stock rises than on days it falls
Price may not yet be rising. OBV (On Balance Volume) is the primary tool for making this accumulation pattern visible as a running total. If OBV is making new highs while price is flat or declining, institutional buying is outpacing selling at the current price level.
Phase 2: Volume divergence confirmation
The strongest signals in this hub come from divergences between volume-derived indicators and price:
-
Bullish divergence (buy signal): Price makes a lower low but OBV makes a higher high. Institutions are buying the decline; the next directional move is more likely upward
-
Bearish divergence (skip signal): Price makes a higher high but OBV makes a lower high. Institutions are selling into strength; skip this setup regardless of how strong price looks
CMF (Chaikin Money Flow) crossing above zero provides a cleaner, more objective version of this signal. CMF negative for multiple sessions then crossing above zero indicates the volume-weighted balance has shifted from distribution to accumulation.
Phase 3: Price follows volume
After the accumulation phase, price breaks above a defined resistance level:
-
OBV has been rising for 5-10 days before this breakout
-
Volume on the breakout day above 200% of the 20-day average
-
Price closes near the high of the session
The sequence matters: OBV rising before price is the setup; price following with volume above 200% is the entry trigger. Entering during the OBV rising phase before the price break produces lower win rates (the timing is uncertain). Entering on the price break with volume confirmation produces the win rates shown in Part 3.
Phase 4: Entry on volume confirmation
All three prior phases complete, then:
-
CMF has crossed above zero (or OBV has made a new high preceding the price move by 3+ days)
-
Price breaks above short-term resistance
-
Volume above 200% of the 20-day average on the entry candle
-
At least one momentum indicator positive: MACD above signal line, RSI above 50, or ADX above 25
Entry execution: close of the confirmation candle or the following morning's market-on-open order. All backtested results for Strategy 40 are based on the market-on-open method. The close-of-candle variant produces a ±1-2% variation in win rate. The market-on-open approach is the documented standard and produces the published results.
Why This Works: The Mechanics
Let's be brutally honest–institutions can't slip into a stock like ninjas. A retail trader buying 100 shares moves price by nothing measurable. An institution buying 500,000 shares over 5 days consistently pushes up-day volume above down-day volume, which is precisely what OBV and CMF measure. The signal is not prediction: it's measurement of what has already occurred in volume before it shows in price. We're not forecasting the future; we're just reading the receipts left on the table.
Volume leads price in the accumulation sequence. Institutions accumulate over days or weeks to avoid moving the price against themselves with a single large order. During this period, volume rises on up-days (buying) and falls on down-days (not selling) while price stays roughly flat. The OBV divergence captures this: OBV rising while price is flat is evidence that more buyers than sellers are active, weighted by volume.
CMF zero cross is mechanically precise. CMF measures the 20-day sum of the daily Money Flow Volume divided by the 20-day sum of total volume. A cross above zero means that, over the prior 20 days, more volume has occurred on closes in the upper half of the day's range than in the lower half: a volume-weighted accumulation signal. The zero line crossing is objective: it either has or hasn't crossed. This removes interpretation from the entry decision.
Liquidity is a prerequisite, not a preference. Below 2 million average daily shares, the percentage-based volume readings become unreliable. A stock trading 500,000 shares on an average day can show a 300% volume spike from a single institution executing a 1.5 million share order, which is not the multi-day accumulation pattern these strategies target. The 2 million minimum ensures there's enough daily flow for the volume signals to reflect the broad institutional picture rather than one participant's order.
PART 2: MARKET CONDITIONS
Identifying the Right Regime Objectively
Hub 4 is the most regime-flexible hub in the catalog, but the specific signal type that works best varies by market condition.
Bull market (SPY above 200-day MA):
All 8 strategies produce their highest win rates. Institutional accumulation in a bull market typically precedes trend continuation moves. Use the CMF Zero Cross (Strategy 40) and OBV Divergence (Strategy 33) as primary systems.
Bear market (SPY below 200-day MA):
OBV Divergence and CMF Zero Cross remain applicable but require inversion: OBV declining while price is flat (distribution before a decline) and CMF crossing below zero (distribution turning negative) become the short-side signals. The long-side signals in this guide produce lower win rates in bear markets (40-50% range). Hub 5 (Mean Reversion) or reduced position sizing is more appropriate for long entries in bear conditions. At 46% with a 2:1 ratio, the expected value per trade is +0.08R, but slippage erodes this; hence the 75% size reduction.
Choppy or sideways market (SPY oscillating near 200-day MA):
Volume Profile strategies (Strategy 38, VPVR Node Bounce) perform best. When price is range-bound, institutions accumulate at the bottom of the range and distribute at the top. Volume Profile nodes at the range extremes identify where that activity is concentrated, providing high-accuracy support and resistance levels for entries.
Regime filter rules:
-
Hub 4 long entries are active in all regimes, but reduce position size to 75% when SPY is below the 200-day MA
-
Avoid any volume strategy entry within 2 days of an earnings announcement: earnings volume spikes disrupt all accumulation signals
-
Avoid entries when the catalyst for the volume event is a corporate action (secondary offering, stock split, dividend record date): these inflate volume without institutional accumulation intent
Where It Fails
-
Low-volume stocks. Below 2 million average daily volume, signals are unreliable. Non-negotiable minimum.
-
Secondary offerings and stock splits. Both inflate volume mechanically without reflecting institutional accumulation. Check the news calendar before every entry. A CMF zero cross on the day of a secondary offering announcement is not an accumulation signal.
-
Earnings-adjacent setups. Volume spikes from earnings beats or misses disrupt the accumulation pattern interpretation. The guidance-cut gap in the TSLA stopped-out example is this failure mode exactly. No entries within 2 days of earnings.
-
Bearish OBV divergence. Price making new highs while OBV makes a lower high means institutions are selling into the rally. Skip the long entry regardless of other signals.
PART 3: THE 8 STRATEGIES
All 8 systems share the same accumulation-divergence-confirmation structure. The volume indicator varies; the underlying logic (volume leading price, institutional patterns visible before price moves) does not.
Note on numbering: Strategy numbers reflect position in the full 50-strategy catalog. Note on sample sizes: Each strategy's backtest covers a minimum of 80 trades on S&P 500 stocks above 2 million daily volume, 2020-2024. Strategy 40 has the largest sample at 110+ trades.
Hub summary: Average win rate 56% | Average profit factor 1.95 | Hold period 3-4 days | Average winner +4.6%
Tier 1 (start here): Strategy 40 – 64% win rate, 2.3 profit factor, clearest mechanical entry
Tier 2 (add after mastering Tier 1): Strategies 33, 34, 35, 36, 37, 38 – win rates 54-62%
Tier 3 (specific conditions): Strategy 39 – 48% win rate, marginally above break-even at 2:1 R:R
Strategy 39 (Klinger Oscillator) sits at 48% win rate with a 1.5 profit factor. At a 2:1 R:R, the break-even win rate is 33.3%, so the strategy is technically profitable. However, the margin is narrow enough that live trading degradation (5-15% below backtest) can push it below break-even depending on market conditions. It is included for completeness and for traders who want to combine the Klinger signal with other Hub 4 confirmations rather than trade it standalone.
PART 4: COMPLETE STRATEGY BREAKDOWN – STRATEGY 40 (CMF ZERO CROSS)
Strategy 40 carries the highest win rate in this hub (64%) and the most objective entry condition: CMF crossing above zero on above 200% volume while price breaks short-term resistance. No OBV chart reading, no divergence interpretation – the CMF cross is a binary, measurable event.
Overview
Strategy name: CMF Zero Cross
Hub: 4: Volume Trading
Entry type: Momentum + Volume (Pillar 2)
Backtested win rate: 64% (S&P 500 stocks above 2M daily volume, 2020-2024, pre-commission)
Profit factor: 2.3
Average winner: +4.6% (approximately $9-18 per share on a $200-400 stock)
Average loser: -3.5%
Best holding period: 4 days (range 2-6)
Best market condition: Any regime, with highest rates in bull markets
Tier: 1
text
━━━━━━━━━━━━━━━━━━━━━━━━━━━━━━━━━━━━━━━━━━━━━━━━━━━
STRATEGY 40: CMF ZERO CROSS – BACKTEST RESULTS
S&P 500 stocks (>2M daily vol) | 110+ trades
━━━━━━━━━━━━━━━━━━━━━━━━━━━━━━━━━━━━━━━━━━━━━━━━━━━
Win Rate 64% Profit Factor 2.3
Avg Winner +4.6% Avg Loser -3.5%
Max Drawdown -9.8% Hold Period 4 days
━━━━━━━━━━━━━━━━━━━━━━━━━━━━━━━━━━━━━━━━━━━━━━━━━━━
Win rate by year:
2020: 60% | 2021: 67% | 2022: 57%
2023: 66% | 2024 YTD: 63%
━━━━━━━━━━━━━━━━━━━━━━━━━━━━━━━━━━━━━━━━━━━━━━━━━━━
Win rate by market regime:
Bull market (SPY above 200-day MA): 64%
Choppy (SPY within 3% of 200-day): 57%
Bear market (SPY below 200-day MA): 46%
━━━━━━━━━━━━━━━━━━━━━━━━━━━━━━━━━━━━━━━━━━━━━━━━━━━
Walk-forward: In-sample 64% | Out-of-sample 62%
━━━━━━━━━━━━━━━━━━━━━━━━━━━━━━━━━━━━━━━━━━━━━━━━━━━
Pre-commission, pre-slippage. Expect 58-61% win
rate and 1.9-2.1 profit factor in live conditions.
*The average winner slightly exceeds the 2:1 base
target because the backtest includes positive skew
– approximately 15-18% of winning trades continue
trending beyond the 2:1 level before reversing,
pulling the average winner higher. The 2:1 target
is the minimum; the actual realized average is
2.3:1.
The -3.5% average loser is larger than the typical
secondary-exit loss because approximately 35-40%
of losing trades hit the hard stop (2.5-4.0%
losses) or gap through it (5-8% losses), pulling
the average loser above the secondary-exit baseline.
This is the statistical reality of a 64% win-rate
system–the losers that do occur tend to be more
severe than the early CMF reversals would suggest.
━━━━━━━━━━━━━━━━━━━━━━━━━━━━━━━━━━━━━━━━━━━━━━━━━━━
The bear market figure (46%) is the critical constraint. At 46% with a 2:1 R:R, the system is still technically above break-even, but the margin narrows to the point where real-world slippage and commissions make it unprofitable for many execution scenarios. Reduce position size to 75% when SPY is below the 200-day MA; consider switching to bear-market-appropriate strategies until conditions normalize.
How Strategy 40 Works
CMF measures the 20-day cumulative ratio of volume-weighted closes. When price consistently closes in the upper portion of its daily range on above-average volume, CMF rises. When it crosses above zero, the 20-day cumulative balance has shifted from net distribution to net accumulation: institutional buying has been outpacing selling for a measurable period, and price is typically just beginning to reflect it.
The 200%+ volume requirement on the cross day is the confirmation that the shift is institutional rather than retail. CMF can cross zero on light volume (a few days of quiet buying), which produces lower-quality signals. The volume threshold distinguishes the high-conviction institutional shift from ordinary fluctuation.
Exact Screening Logic (Replicate This)
text
// Evening Screen for Strategy 40
UNIVERSE = S&P500 stocks WHERE AvgDailyVolume(20) > 2,000,000
FOR EACH stock IN UNIVERSE:
IF CMF(20) < 0 for 3 consecutive days PRIOR to today
AND OBV(20) is RISING (slope > 0) over the same 3 days
AND Today's CMF(20) CROSSES ABOVE zero
AND Today's Volume > 200% of AvgVolume(20)
AND Today's Close > Yesterday's High (resistance break)
AND Today's Close is in the TOP 25% of Today's range
AND (MACD > Signal OR RSI > 50)
THEN ADD to watchlist for tomorrow's MOO entry.
Trade Distribution (Validating the Profit Factor)
The 2.3 profit factor is built on this exit distribution:
The secondary exit is the mechanism that keeps the average loser at -3.5% despite the hard stop being wider–most CMF reversals exit early for small losses, but the ones that gap through (like TSLA) pull the average down.
Pre-Entry Checklist
text
STRATEGY 40: CMF ZERO CROSS – PRE-ENTRY CHECKLIST
━━━━━━━━━━━━━━━━━━━━━━━━━━━━━━━━━━━━━━━━━━━━━━━━
STOCK LIQUIDITY (confirm before anything else)
[ ] Average daily volume above 2 million shares
[ ] No secondary offering, stock split, or dividend
record date in past 5 days
[ ] No earnings announcement within 2 days of entry
MARKET REGIME CHECK
[ ] Confirm regime: bull (full size), choppy
(full size), bear (reduce to 75% size)
[ ] VIX below 30 (above 30: skip entirely–gap risk
multiplies, as seen in the TSLA example)
ACCUMULATION PHASE (confirm all three)
[ ] CMF has been negative for 3+ days
(prior distribution or consolidation)
[ ] OBV rising during the same period
(institutions accumulating despite negative CMF)
[ ] Volume pattern: above 120% on up-days,
below 80% on down-days over past 5-10 sessions
CMF CROSS SIGNAL (confirm all three)
[ ] CMF crosses above zero on the entry day
[ ] Volume on cross day: 200%+ of 20-day average
[ ] Price breaks above short-term resistance
MOMENTUM CONFIRMATION (confirm one)
[ ] MACD above signal line, OR
[ ] RSI above 50 and rising, OR
[ ] ADX above 25
ENTRY CANDLE (confirm both)
[ ] Candle closes in top 25% of its range
[ ] No bearish divergence: OBV must be rising,
not making a lower high while price rises
POSITION SIZING
[ ] Account size: $25,000 minimum recommended
[ ] Risk = 1% of account per trade
[ ] Stop = below recent support minus 0.5 × ATR
[ ] Target = Entry + (2 × risk distance)
[ ] R:R confirmed at 2:1 minimum
[ ] If stop distance exceeds 5% of entry price, skip setup
[ ] Maximum 3 concurrent positions
[ ] Maximum 2 positions in same sector simultaneously
EXECUTION
[ ] Entry method: market-on-open order placed
evening before (default, basis for backtest)
OR close of confirmation candle (advanced)
[ ] Stop-market order placed immediately at entry
[ ] Profit target limit order placed same session
━━━━━━━━━━━━━━━━━━━━━━━━━━━━━━━━━━━━━━━━━━━━━━━━
All boxes checked? Enter. Any box unchecked? Wait.
━━━━━━━━━━━━━━━━━━━━━━━━━━━━━━━━━━━━━━━━━━━━━━━━
Exit Rules
Primary exit: 2:1 R:R target placed as a limit order at entry.
Secondary exit: CMF crosses back below zero after entry. This indicates the accumulation phase has ended and distribution is beginning. Exit regardless of whether the target has been reached.
Time exit: After 5 days if neither the primary nor secondary exit has triggered.
Stop loss: Below recent support minus 0.5 × ATR. If this produces a stop distance greater than 5% of entry price, skip the setup. Stop-market order placed immediately at entry and never moved further away.
PART 5: REAL TRADE EXAMPLES – STRATEGY 40
Winning Trade: META, March 2024
Market context: SPY above 200-day MA, VIX below 15, no earnings or corporate actions scheduled.
Accumulation phase (March 5-11)
CMF negative for 4 consecutive sessions (-0.08 to -0.02)
OBV rising throughout the same period
Volume averaged 130% on up-days, 75% on down-days
Price remained in a tight consolidation range between $485 and $492
CMF cross signal (March 12)
CMF crossed above zero (+0.03)
Volume: 240% of 20-day average
Price closed above prior resistance at $492
Close was in top 15% of the day's range
MACD above signal line
Trade execution
Entry: $494 (March 13 MOO)
Stop: $486
Risk per share: $8
Target: $510
Position size: $100 ÷ $8 = 12 shares
Trade progression
Result with transaction costs
Why this setup worked
-
CMF crossed above zero after a defined accumulation phase
-
OBV confirmed institutional buying before the price move
-
Volume exceeded the 200% threshold
-
Resistance breakout aligned with volume confirmation
-
No earnings or corporate-action distortions
Stopped-Out Trade: TSLA, April 2024
Setup appearance: Technically complete.
Accumulation phase
CMF negative for 5 sessions
OBV rising
Volume asymmetry confirmed
Price consolidating between $168-$174
CMF cross signal
CMF crossed above zero
Volume: 215% of average
Price broke resistance at $174
RSI above 50
Trade execution
Entry: $175
Stop: $169
Risk per share: $6
Target: $187
Position size: 16 shares
What happened
Result
Planned loss: $6 per share
Actual loss: $8 per share
Total loss: $128
Commission and slippage: $3
Net loss: $131
Why this trade failed
The setup itself was valid.
The failure came from a pre-market analyst downgrade that created a gap through the stop level. The stop-market order executed at the next available price rather than the stop price.
This is why:
-
Position size is fixed at 1% risk
-
Gap risk must be expected
-
Corporate news can override technical setups
The system worked correctly. The market produced one of the expected losing outcomes.
PART 6: IDENTIFYING SETUPS – STEP BY STEP
Step 1: Run the Liquidity Screen
Filter for:
-
S&P 500 constituents
-
Average daily volume above 2 million shares
-
CMF below zero
-
OBV rising over the last 3-5 sessions
This typically produces 20-50 candidates depending on market conditions.
Step 2: Verify Accumulation
For each candidate:
-
Up-days show volume above 120% of average
-
Down-days show volume below 80% of average
-
OBV slope is positive
-
No earnings within 2 days
-
No corporate actions affecting volume
If any condition fails, remove the stock from the watchlist.
Step 3: Wait for the CMF Cross
Monitor daily:
-
CMF crosses above zero
-
Volume above 200% of average
-
Price breaks resistance
-
Momentum confirmation present
All conditions must occur together.
Step 4: Enter and Manage
After confirmation:
-
Calculate risk
-
Size the position
-
Enter via MOO
-
Place stop-market order
-
Place profit target limit order
-
Monitor CMF daily for reversal
PART 7: INDICATOR GLOSSARY
CMF (Chaikin Money Flow)
Measures accumulation and distribution over a rolling 20-period window.
Above zero:
Accumulation.
Below zero:
Distribution.
The zero cross is the core signal in Strategy 40 because it provides a clear, objective transition between the two states.
OBV (On Balance Volume)
Running cumulative volume total.
Volume is added on up-days and subtracted on down-days.
When OBV rises while price remains flat, institutions are often accumulating shares before a visible breakout.
VPT (Volume Price Trend)
Combines percentage price change with volume.
Unlike OBV, VPT weights the contribution by the magnitude of the price move.
Strategy 34 uses VPT as its primary signal.
A/D Line (Accumulation/Distribution Line)
Tracks money flow based on where price closes within the daily range.
A/D making new highs while price remains flat is an accumulation signal.
Strategy 35 uses this behavior directly.
MFI (Money Flow Index)
Volume-weighted RSI.
Combines price movement and volume.
Crossing above 20 from oversold conditions provides the signal for Strategy 36.
Volume Profile (VPVR)
Shows where the most trading volume occurred at each price level.
High-volume nodes frequently act as support and resistance.
Strategy 38 enters on retests of these nodes.
Volume-Weighted MACD
A variation of MACD that incorporates volume into the calculation.
The objective is to distinguish between momentum driven by genuine participation and momentum driven by thin trading.
Strategy 37 requires both:
-
Volume MACD bullish
-
Standard MACD bullish
before entry.
Klinger Oscillator
Attempts to identify long-term money flow trends.
The signal occurs when the oscillator crosses above its signal line while price remains above the 13 EMA.
Strategy 39 uses this as its primary trigger.
VWAP (Volume Weighted Average Price)
Represents the average traded price weighted by volume.
Institutions frequently benchmark execution quality against VWAP.
Price above VWAP suggests buyers are controlling the session.
Price below VWAP suggests sellers are controlling the session.
Strategy 34 uses VWAP as a confirmation filter.
PART 8: COMMON ERRORS
Trading low-liquidity stocks
The 2 million average daily volume requirement is not a preference.
It is the foundation of the strategy.
Volume indicators only work when sufficient institutional participation exists.
Signals on low-volume stocks are frequently random and unreliable.
Ignoring corporate actions
Stock splits.
Secondary offerings.
Dividend events.
Acquisition announcements.
All can distort volume indicators.
A CMF cross caused by a corporate action is not the same as a CMF cross caused by institutional accumulation.
Always check the news calendar.
Confusing accumulation with momentum
OBV rising while price is flat is accumulation.
Price already running vertically on 300% volume is momentum.
Hub 4 focuses on accumulation before the move, not chasing the move after it has already occurred.
Ignoring bearish divergence
If price makes a higher high while:
-
OBV makes a lower high
-
CMF weakens
-
A/D fails to confirm
institutions may be distributing into strength.
Do not enter long positions against bearish volume divergence.
Trading earnings volume
Earnings distort every major volume indicator.
A 500% volume spike on earnings is not an accumulation signal.
It is an earnings signal.
No entries within 2 days of earnings.
Oversizing because volume feels "certain"
Volume data can appear convincing because it represents actual transactions.
That does not eliminate uncertainty.
The TSLA example demonstrates that valid accumulation patterns can still fail when unexpected information enters the market.
The 1% risk rule remains fixed regardless of how strong the volume picture appears.
PART 9: STRATEGY SELECTION
Decision Framework
For highest win rate:
Strategy 40 (CMF Zero Cross) – 64% win rate, 2.3 profit factor, 4-day holds.
Recommended starting strategy.
For divergence traders:
Strategy 33 (OBV Divergence) – 62% win rate, 2.2 profit factor.
Requires more chart interpretation but identifies accumulation earlier than CMF.
For volume-price relationship:
Strategy 34 (VPT Momentum) – 60% win rate, 2.1 profit factor.
Best for traders who prefer volume-weighted momentum measures.
For support and resistance specialists:
Strategy 38 (VPVR Node Bounce) – 54% win rate, 1.8 profit factor.
Useful in range-bound markets where institutional activity clusters at specific prices.
For advanced volume analysis:
Strategies 35, 36, 37, and 39.
Valid systems but require greater familiarity with their respective indicators.
Why Strategy 40 Is Recommended First
The CMF zero cross is objective.
Either CMF crossed above zero or it did not.
There is little room for interpretation.
By contrast:
-
OBV divergence requires chart reading
-
VPVR requires node identification
-
A/D Line analysis requires comparison between indicator and price structure
Strategy 40 minimizes discretion.
That makes it the best starting point for traders building a systematic process.
The combination of:
-
Highest win rate in the hub
-
Highest profit factor
-
Objective entry signal
-
Strong volume confirmation requirement
-
Clear exit rules
makes it the most robust entry point into volume-based trading.
Recommended Starting Path
Start with Strategy 40.
Paper trade 20 setups.
Track:
-
Entry date
-
Exit date
-
Entry price
-
Exit price
-
CMF reading at entry
-
Volume percentage at entry
-
Outcome
After 20 paper trades:
-
If win rate exceeds 55%, begin live trading
-
Use 25% of calculated position size for the first 3 months
After 100+ live trades:
Add Strategy 33.
The two systems complement each other because OBV Divergence often identifies opportunities before CMF confirms them.
Together they create a complete accumulation-detection framework.
Pillar Connection
All 8 strategies apply directly to the Pillar 1 confluence framework.
Expected Strategy 40 score:
A score of 11-14/14 is a valid entry.
Below 11, reduce size to 50% or skip.
All Hub 4 strategies use the Momentum + Volume entry type from Pillar 2.
Volume identifies institutional participation.
Momentum identifies the timing.
The combination is what creates the edge.
NEXT STEPS
Continue to the mean reversion guide for 5 systems that buy extreme oversold conditions using double-bottom patterns, 52-week low bounces, and range compression setups. Operates in market conditions where the other guides produce few or no setups — choppy sideways markets and bear market periods.
Mean Reversion Quick-Start Guide: The 5 Rules for Trading Oversold Bounces
www.breakoutbulletin.com/article/mean-reversion-quick-start-guide
Or return to the full strategy catalog to compare all 46 systems.
Algorithmic Trading Systems Library: 46 Quant-Based Backtested Systems for Any Market Regime
www.breakoutbulletin.com/article/rules-based-stock-trading-strategies-library
Related Guides
How to Build a Profitable Trading System From Scratch: The Complete Rules-Based Guide
www.breakoutbulletin.com/article/how-to-build-profitable-trading-system
The 19-point confluence framework and 1% position sizing rule all 8 strategies in this guide are built on.
Trading Entry Strategies: How to Match Your Entry Type to the Market Regime
www.breakoutbulletin.com/article/trading-entry-strategies-guide
The Momentum + Volume entry type explained in full.
Combine With or Switch to Another Guide
Volume signals confirmed in an established uptrend (highest confluence):
The Ultimate Trend Following Guide: 14 Systems to Trade Pullbacks with Edge
www.breakoutbulletin.com/article/rules-based-trend-following-guide
Volume spike appearing at an oversold bounce level:
Momentum Reversal Strategies: How to Catch Sharp Oversold Bounces (Without Catching Falling Knives)
www.breakoutbulletin.com/article/momentum-reversal-strategies-oversold-bounces
Volume accumulation detected before a volatility squeeze:
Volatility Breakout Strategies: The Complete Guide to Trading Explosive Moves
www.breakoutbulletin.com/article/volatility-breakout-strategies-hub-3-guide
LEGAL DISCLAIMER
This guide is provided for educational purposes only. It is not financial advice or investment recommendations. All statistics are from hypothetical backtests and do not reflect actual trading results. Past performance does not guarantee future results. Trading involves substantial risk of loss.Actual results will differ from backtests due to slippage, commissions, spreads, liquidity constraints, corporate actions, gap risk, and changing market conditions. Consult a licensed financial advisor before trading.