
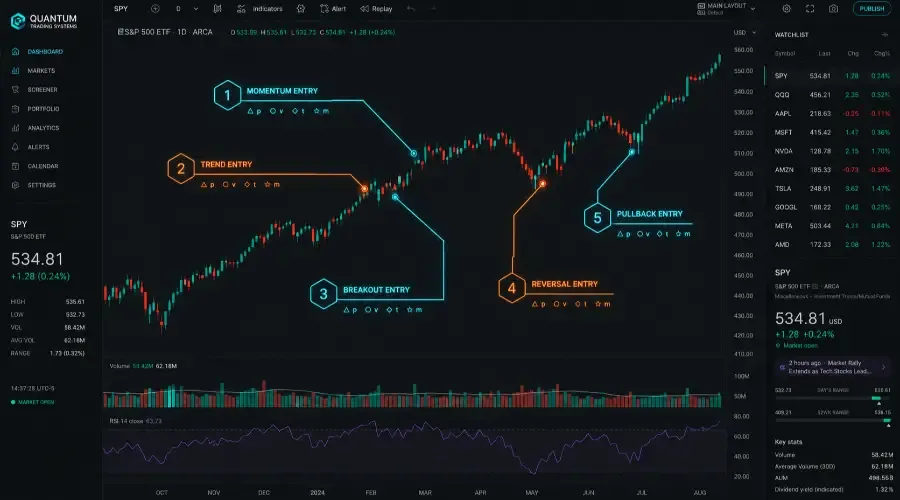
How to Choose the Right Entry for Every Market Condition
WHY ENTRY TYPE MATTERS MORE THAN INDICATORS
A trader with a basic moving average crossover and consistent discipline will outperform a trader running fifteen indicators with no framework for when to apply them. The reason is structural: the entry type creates the edge, not the indicator.
Two traders can use the exact same stock, the same RSI reading, and the same chart period, and produce different results simply because they're using different entry types. One buys early momentum acceleration; the other waits for a confirmed pullback within an established trend. In a trending market, the second trader wins more often. In a choppy market, the first does. Neither indicator set is superior: the market condition determines which entry type is appropriate, and choosing correctly is worth more than any indicator refinement.
This guide covers five core entry types, how each works mechanically, when each outperforms, and how to match entry type to market condition before the trade opens.
PART 1: THE FIVE CORE ENTRY TYPES
Every systematic trading strategy is built around one of five entry types, or a deliberate combination of two:
- Momentum Entry: buy when price accelerates early in a move
- Trend Entry: buy pullbacks within an established trend
- Breakout Entry: buy when price closes above a resistance level on volume
- Reversal Entry: buy when price bounces off a support level
- Pullback Entry: buy the dip within a confirmed uptrend (highest historical win rate)
The entry type decision happens before the indicator selection decision. An RSI reading means something different depending on which entry type is being applied. At RSI 28 in a breakout setup, it's a warning. In a reversal setup at confirmed support, it's a signal.
Each entry type is covered in full below, including a real trade example, the market conditions where it outperforms and underperforms, common execution errors, and position sizing.
PART 2: ENTRY TYPE 1 – MOMENTUM ENTRY
What It Is
A momentum entry buys early price acceleration, before a full trend is established. The signal is a momentum indicator (RSI, TSI, Stochastic, MACD) crossing its threshold while volume is expanding, confirming that buying conviction is building.
This is distinct from a reversal entry (which requires a bounce from a defined support level) and a trend entry (which requires an established trend). Momentum entry catches the earliest detectable stage of a move, which produces better risk:reward at the cost of a slightly lower win rate.
How It Works
Step 1: Market condition check. The market is choppy or in the early stages of turning. Volume is increasing. Price is making fresh directional moves.
Step 2: Momentum indicator signal. RSI crosses above 50, TSI crosses above its signal line, Stochastic crosses above 20, or MACD histogram turns positive.
Step 3: Entry execution. Enter on the crossover candle or the candle after it closes above the signal line. Do not enter before the crossover.
Step 4: Stop placement. Below the crossover candle's low, or below the most recent swing low.
False signal filter: One crossover is not sufficient. Wait for two consecutive candles to close above the signal line, or confirm that volume on the crossover candle is above 120% of the 20-day average. A crossover on weak volume reverses frequently within one or two candles.
Real Example: TSLA, March 15, 2024
Setup:
- TSLA down 3% in morning session, trading at $170.50
- Daily RSI: 28 (oversold)
- Volume: 180% of 20-day average (selling climax)
- Hammer candle forming at session low ($168)
Momentum signal confirmed:
- RSI crosses above 30
- Next candle closes at $172.80 (green, strong close)
Trade execution:
- Entry: $173 (next candle open)
- Stop: $167.50 (below hammer low plus buffer)
- Target: $184 (2:1 R:R based on $5.50 risk per share)
- Risk per share: $5.50
Result:
- Bounced to $177 within two hours
- Exited first half at $176 (+$3/share, 54.5% return on risk)
- Trailed second half with ATR stop, exited at $185 (+$12/share, 218% return on risk)
- Combined average: 136% return on risk
- Holding period: 5 hours (intraday)
Position sizing:
- Account: $10,000, risk 1% = $100
- $100 ÷ $5.50 risk per share = 18 shares (rounded down)
- Capital deployed: 18 × $173 = $3,114 (31% of account)
When Momentum Entry Works
Momentum entry performs best in volatile, choppy markets where sharp short-term moves occur frequently. After significant sell-offs that create oversold conditions. In high-beta stocks (TSLA, NVDA) with sufficient daily range to hit 2:1 targets within a short hold. During the first two hours of the trading session when volatility and participation are highest.
It underperforms in strong trending markets where momentum signals trigger but the move fades before reaching target. In low-volume sessions where crossovers produce weak follow-through. Before major news or earnings where gap risk distorts the setup.
Backtested ranges (pre-commission, pre-slippage):
- Win rate: 55-60%
- Profit factor: 1.8-2.1
- Best holding period: 30 minutes to 4 hours
- Best timeframe: 5-minute to 60-minute charts
Common Momentum Entry Errors
Entering before the crossover. "RSI is at 28 and nearly crossing" is not a signal. Entering before confirmation means accepting a higher rate of false signals. Wait for the actual crossover.
No volume check. A crossover on below-average volume indicates weak participation. Volume must be 120% or higher on the crossover candle for the signal to carry weight.
Holding too long. Momentum entries peak quickly and fade. Holding beyond the initial 2-4 hour window hoping for more typically produces profit give-back. Trail stops aggressively or exit at the first target.
Entering in a tight range. Momentum works when volatility is expanding. If ATR is contracting and price is moving in a narrow band, crossovers produce whipsaw rather than directional follow-through.
PART 3: ENTRY TYPE 2 – TREND ENTRY
What It Is
A trend entry buys pullbacks within an already-established uptrend. The trader is not trying to catch the beginning of a move. The trend is confirmed, the stock has pulled back to a support level, and the entry is on the bounce that continues the trend.
The signal requires trend confirmation on two timeframes (weekly and daily), a healthy pullback characterized by decreasing volume, and a bounce candle showing renewed buying.
How It Works
Step 1: Confirm uptrend on the weekly chart. Price above 20-week EMA. 20-week EMA above 50-week EMA. Both rising.
Step 2: Confirm uptrend on the daily chart. Price above 20-day EMA and 50-day EMA. Both rising. Stock making higher highs and higher lows.
Step 3: Wait for the pullback. Price retraces from a recent high toward the 20-day EMA or another defined support. Volume decreases during the pullback: this is the critical distinction between a healthy retracement and a reversal. A pullback on rising volume is a warning that the trend is under more pressure than the setup assumes.
Step 4: Enter on the bounce. Price bounces off support. Volume increases on the bounce candle. Green candle closes near the high of its range. Enter on that candle or the next morning's open.
False signal filter: The pullback must show decreasing volume on the way down and increasing volume on the bounce. If volume stays elevated throughout the pullback, the selling pressure hasn't ended and the bounce is likely to be weak.
Real Example: AAPL, February 2024
Weekly trend confirmed:
- AAPL price $189 vs 20-week EMA $165 (above)
- 20-week EMA $165 vs 50-week EMA $155 (above)
- Both rising
Daily trend confirmed:
- Price $189, 20-day EMA $187, 50-day EMA $182
- Both moving averages rising
Pullback phase:
- Price pulled back from $189 to $186 over two days
- Volume decreased throughout (healthy)
Bounce signal:
- Price bounced to $188 on day three
- Green candle on increasing volume
- Entry signal confirmed
Trade execution:
- Entry: $188.50
- Stop: $184 (below 20-day EMA plus buffer)
- Target: $197.50 (2:1 R:R based on $4.50 risk)
- Risk per share: $4.50
Result:
- Bounced from $188.50 to $195 in four days
- Exited first half at $195 (+$6.50/share, 144% return on risk)
- Trailed second half to $203 (+$14.50/share, 322% return on risk)
- Combined average: 233% return on risk
- Holding period: 6 days
Position sizing:
- Account: $10,000, risk 1% = $100
- $100 ÷ $4.50 = 22 shares
- Capital deployed: 22 × $188.50 = $4,147 (41% of account)
When Trend Entry Works
Trend entry produces its best results in confirmed bull markets with SPY above the 200-day MA. Also works in established bear markets for short entries using the same mechanics inverted. Requires clear directional movement, so a stock that's in an uptrend but churning sideways within it does not qualify.
It underperforms in choppy sideways markets where there is no consistent trend to pull back from. When a trend is overextended (price far above moving averages), pullbacks tend to be deeper and more damaging than the setup assumes.
Backtested ranges (pre-commission, pre-slippage):
- Win rate: 60-68%
- Profit factor: 2.0-2.8
- Best holding period: 3-8 days
- Best timeframe: Daily chart
Common Trend Entry Errors
Entering mid-pullback. Buying before the pullback completes means the stop gets hit more frequently. Wait for the bounce confirmation (a green candle closing near its high on increasing volume) before entering.
Skipping the weekly chart check. The daily setup can look clean while the weekly trend is weakening or reversing. A bounce on the daily that runs into weekly resistance fails consistently. Check the weekly first, every time.
Chasing the breakout instead of waiting for the dip. Entering at the recent high rather than waiting for the pullback produces worse R:R ratios and lower win rates. The mechanics of trend entry require patience between the signal and the trade.
Holding past the natural exit. Trend entries run 3-8 days on average before the next pullback cycle begins. Holding past 8 days without a trailing stop in place typically results in giving back profits as the next retracement starts.
PART 4: ENTRY TYPE 3 – BREAKOUT ENTRY
What It Is
A breakout entry buys when price closes above a resistance level on significantly above-average volume. The setup requires prior consolidation near the resistance level (price approaching quietly), then a clean break with strong volume confirming institutional participation.
The resistance level can be a prior swing high, a round number, a moving average, or a trendline. What matters is that it's been tested multiple times and held, because a clean break of a tested level carries more weight than a break of a level that's been touched only once.
How It Works
Step 1: Identify the resistance level. Prior swing high, round number ($100, $200, $500), 50-day or 200-day MA, or trendline resistance. The level must be clearly defined, not an estimated range.
Step 2: Wait for the approach. Price rallies toward resistance on below-average volume. The quiet approach indicates the market hasn't committed to the break yet.
Step 3: The break. Price closes above resistance on volume 160% or higher above the 20-day average. The candle closes in the top 25% of its range. This is the signal.
Step 4: Entry and stop. Enter on the break candle or the next candle's open. Stop below the breakout level.
Retest filter: A clean breakout frequently retests the broken resistance level (now acting as support) within 1-3 days, holds, then continues higher. Entering on the retest rather than the initial break improves risk:reward and filters fakeouts. If price breaks, retests, and holds, it's a confirmed breakout. If price breaks and immediately falls back below the level, it's a fakeout.
Volume requirement is non-negotiable. Breakouts on volume below 160% of average fail at a rate that makes the setup unprofitable. The difference between a real breakout and a fakeout, in the majority of observed cases, is volume.
Real Example: NVDA, January 2024
Resistance identified:
- NVDA consolidating between $460-$485
- Resistance level: $485 (top of range, tested multiple times)
Approach phase:
- Price rallied toward $485 on below-average volume over 3-4 days
Breakout signal:
- Price broke above $485
- Volume: 65M shares vs 35M average = 185% of average
- Candle closed at $488 (top quartile of range)
Trade execution:
- Entry: $489 (next candle open)
- Stop: $483 (below breakout level)
- Target: $501 (2:1 R:R based on $6 risk per share)
- Risk per share: $6
Result:
- Continued to $512 over 6 days
- Exited at target $501 (hit on day 6)
- Profit: $12/share on 16 shares = $192
- Return on risk: 192% on $100 risked
- Holding period: 6 days
Position sizing:
- Account: $10,000, risk 1% = $100
- $100 ÷ $6 = 16.7 → 16 shares
- Capital deployed: 16 × $489 = $7,824 (78% of account)
When Breakout Entry Works
Breakout entries produce their best results after defined consolidation periods, when volatility has compressed and is ready to expand. In strong trending markets where breakouts extend existing trends rather than starting from a standing start. At psychologically significant levels (round numbers, prior all-time highs) where many traders watch the same level.
Breakouts fail most often in choppy markets where price oscillates through resistance levels without follow-through. Without volume confirmation, low-volume breaks reverse in hours because the move was not supported by real buying. Before news or earnings where the catalyst hasn't yet arrived and the break is premature.
Backtested ranges (pre-commission, pre-slippage):
- Win rate: 58-66% (volume-confirmed breakouts at 160%+ average)
- Profit factor: 1.9-2.4
- Win rate drops to 50-55% on breakouts with 100-120% volume
- Best holding period: 2-10 days
- Best timeframe: Daily chart
Common Breakout Entry Errors
Entering without volume confirmation. Volume below 160% of average on a breakout produces failed moves at a rate that makes the setup unprofitable. This single filter removes the majority of fakeouts.
Chasing the break too late. Entering three candles after the initial breakout means more distance to the stop and less distance to the target. If the entry is missed on the break candle, wait for the retest.
Misidentifying the resistance level. The actual resistance level is where price has repeatedly stalled, not where it seems like it should stall. Volume profile analysis at each price level is more reliable than visual estimation.
No volatility check. A breakout in a stock with a narrow average daily range (below 1.5% ATR) may not produce enough movement to reach a 2:1 target within a reasonable hold period. Stocks with 2%+ average daily range generate more usable momentum after breakouts.
PART 5: ENTRY TYPE 4 – REVERSAL ENTRY
What It Is
A reversal entry buys when price bounces off a well-defined support level after a significant decline. The signal requires a specific reversal candlestick pattern at the support level, combined with volume confirming that buying has entered.
The distinction from a trend pullback entry is the context: reversal entries occur after more significant declines (5-12%) rather than the shallow 3-5% pullbacks of trend entries. The setup has higher potential reward (3:1 R:R is appropriate when support is confirmed) but requires tighter signal criteria.
How It Works
Step 1: Identify the support level. Prior swing low, round number, 20-day or 50-day MA, Fibonacci retracement (38.2%, 50%, 61.8%). The level must have held at least twice before.
Step 2: Watch for the approach. Price falls toward support on increasing volume. The selling is visible and measurable.
Step 3: Reversal candle. A hammer (long lower wick, small body near the top), bullish engulfing (small red candle followed by a larger green candle closing above the red candle's open), or morning star (three-candle reversal) forms at the support level.
Step 4: Entry. Enter on the reversal candle's close or the next candle's open. Volume on the reversal candle must increase relative to the prior session. A reversal candle on decreasing volume is a weak signal.
Falling knife filter: Support must have held at least twice previously. First-time tests of a level fail at a significantly higher rate than tested levels. Without at least two prior bounces at the same price, the "support level" is an estimate, not a structural fact.
Three-signal requirement: For highest probability, three confirmations should be present before entry: a specific reversal candle pattern, volume increase on the reversal candle, and higher timeframe support at or near the same level. Missing any one of the three reduces the setup quality materially.
Real Example: SPY, October 2023
Support level identified:
- SPY pulled back from $435 to the $410 level
- $410 was prior support, tested and held twice in the previous 6 months
- Round number reinforcement
Approach phase:
- SPY fell from $435 to $420 on increasing volume
- Continued toward $410
Reversal signal:
- SPY reached $410 and formed a hammer candle
- Low: $405 (5-point wick below the body)
- Close: $409 (body in top of range)
- Volume: 200M shares, 180% of 20-day average
Trade execution:
- Entry: $410 (next candle open)
- Stop: $405 (below hammer low plus buffer)
- Target: $425 (3:1 R:R on this high-probability structural reversal)
- Risk per share: $5
Result:
- Bounced from $410 to $426 in five days
- Exited at target $425
- Profit: $15/share on 20 shares = $300 (after 3:1 R:R)
- Return on risk: 300% on $100 risked
- Holding period: 5 days
Note on R:R: This example uses 3:1 rather than 2:1. Structural support levels tested multiple times and confirmed on multiple timeframes have historically supported a 3:1 target. When confluence is high, the minimum R:R can be raised accordingly.
Position sizing:
- Account: $10,000, risk 1% = $100
- $100 ÷ $5 = 20 shares
- Capital deployed: 20 × $410 = $8,200 (82% of account)
When Reversal Entry Works
Strong bull markets where support levels hold because institutional buyers defend them. After sharp selloffs (5-12%) that leave the stock oversold at a structurally significant level. At moving averages where institutional money mechanically enters. At Fibonacci retracement levels (38.2%, 50%, 61.8% of the prior move) that coincide with prior support.
Reversal entries fail in bear markets where support levels break repeatedly. At new lows where there is no prior support to test. Without a reversal candle, a stock that falls to support and simply stalls rather than showing a specific rejection pattern does not meet the criteria. Without volume on the reversal candle, the bounce has no buying conviction behind it.
Backtested ranges (pre-commission, pre-slippage):
- Win rate: 58-66%
- Profit factor: 2.1-2.6
- Best holding period: 3-7 days
- Best timeframe: Daily chart
Common Reversal Entry Errors
Buying before the reversal candle forms. Entering as price approaches support rather than waiting for the candle confirmation means catching falling knives. Support levels that look solid frequently break on the first test. The reversal candle is the evidence that buying has actually entered, not that it's expected to enter.
No volume on the reversal candle. A hammer forming at support on average volume is a weak signal. Volume above 150% of average on the reversal candle indicates real buying pressure, not just a pause in selling.
Missing higher timeframe confirmation. Daily support at $410 while the weekly chart is in a downtrend produces reversals that reach $415-416 before failing. Higher timeframe alignment is what separates a 3-5% bounce from a trade that reaches its full target.
Support tested for the first time. A price level being touched for the first time is not structural support: it's a level that hasn't been tested yet. Wait for levels with at least two prior confirmed bounces.
PART 6: ENTRY TYPE 5 – PULLBACK ENTRY (HIGHEST WIN RATE)
What It Is
A pullback entry buys a temporary dip within an established uptrend. It's the most selective of the five entry types: it requires a confirmed trend, a healthy shallow pullback (3-8% from the high), and a bounce confirmation with volume. The additional filters produce the highest historical win rate of the five types.
The distinction from the trend entry is emphasis. Both require an established trend and a pullback. The pullback entry is more specific about the pullback depth (3-8%, to the 20-day EMA), more explicit about the volume pattern during the pullback (must decrease on the way down), and treats the bounce as the precise entry trigger rather than the trend confirmation.
How It Works
Step 1: Establish the trend. Price above 20-day EMA, 50-day EMA, and 200-day MA. All three moving averages rising. Higher timeframe (weekly) confirms. Stock making higher highs and higher lows.
Step 2: Watch for the pullback. Price retraces 3-8% from its recent high. Pulls back to the 20-day EMA. Volume decreases during the pullback: this distinguishes a healthy retracement from distribution. Pullback takes 2-4 days.
Step 3: Wait for the bounce. Price bounces off the 20-day EMA. Volume increases on the bounce candle. Candle closes near the high of its range. A momentum indicator (RSI, TSI) turns positive on the bounce day, which is optional but increases signal quality.
Step 4: Entry. Enter on the bounce candle or next morning's open. Stop below the 20-day EMA plus a buffer.
Trend integrity check: If the weekly chart is also showing a pullback or weakening, the daily pullback may be the start of a larger correction rather than a buying opportunity. Before entering any pullback, confirm the weekly trend is intact.
Real Example: MSFT, March 2024
Trend confirmed:
- MSFT price $425
- 20-day EMA $415 (price above)
- 50-day EMA $405 (20-day above 50-day)
- Both rising, stock making higher highs
Pullback phase:
- MSFT rallied from $410 to $425 (high)
- Pulled back to $415 (20-day EMA) over three days
- Volume below average throughout pullback
Bounce signal:
- Price bounced from $415 to $419
- Green candle on increasing volume
- Close at $418, near high of range
- RSI crossed above 50
Trade execution:
- Entry: $419
- Stop: $412 (below 20-day EMA plus buffer)
- Target: $433 (2:1 R:R based on $7 risk per share)
- Risk per share: $7
Result:
- Moved from $419 to $434 in four days
- Exited at $433 (target hit)
- Profit: $14/share on 14 shares = $196
- Return on risk: 196% on $100 risked
- Holding period: 4 days
Position sizing:
- Account: $10,000, risk 1% = $100
- $100 ÷ $7 = 14.3 → 14 shares
- Capital deployed: 14 × $419 = $5,866 (59% of account)
When Pullback Entry Works
Pullback entries perform best in established bull markets where the trend is clear and consistent. Stocks with defined uptrend structure (regular higher highs, regular pullbacks to the 20-day EMA, consistent volume patterns) produce the cleanest setups. The entry is most reliable when the pullback is shallow (3-5%) rather than deep, because deeper pullbacks suggest more selling pressure than a healthy retracement carries.
Pullback entries fail in choppy markets where price oscillates without a consistent trend (pullbacks become the trend). When an existing trend is exhausting after an extended run without pullbacks (overextension followed by a deeper correction rather than a bounce). When pullback volume stays elevated rather than decreasing, this signals distribution rather than normal retracement.
Backtested ranges (pre-commission, pre-slippage):
- Win rate: 61-69% (highest of all five entry types)
- Profit factor: 2.2-2.8
- Best holding period: 2-8 days
- Best timeframe: Daily chart
Common Pullback Entry Errors
Pullback turns into reversal. The most common failure mode. The daily trend looks intact but the weekly is weakening. Always check the weekly before entering, because if the larger trend is under pressure, the pullback extends rather than bouncing.
Waiting for too deep a pullback. Holding out for a 10% pullback to get a "better entry" often means the bounce is weaker when it comes, and the target may be harder to reach from a deeper starting level. Enter on the initial pullback to the 20-day EMA (3-5%), not on the extended version.
Volume stays high during pullback. Healthy retracements happen on below-average volume. Elevated volume during the pullback means selling pressure is active, not fading, and the bounce is less likely to sustain.
Higher timeframe not confirmed. This is the same error as the trend entry. A clean daily pullback setup in a weekly downtrend produces a bounce that fails before the target. Weekly confirmation is not optional.
PART 7: COMPARING THE FIVE ENTRY TYPES
Side-by-Side
| Entry Type | Win Rate | Profit Factor | Hold Period | Best Regime | Complexity |
|---|---|---|---|---|---|
| Momentum | 55-60% | 1.8-2.1 | 30 min to 4 hrs | Choppy | Low |
| Trend | 60-68% | 2.0-2.8 | 3-8 days | Trending | Medium |
| Breakout | 58-66% | 1.9-2.4 | 2-10 days | Post-consolidation | Medium |
| Reversal | 58-66% | 2.1-2.6 | 3-7 days | At support levels | Medium |
| Pullback | 61-69% | 2.2-2.8 | 2-8 days | Trending | Medium |
On these ranges: All figures are from hypothetical backtests on S&P 500 stocks, 2020-2024, pre-commission and pre-slippage. Live trading results will be 5-15% lower after execution costs. A 65% backtest win rate should be expected to produce 58-62% in live conditions.
Entry Timing by Type
The right order execution method varies by entry type:
Momentum entries use market orders at open or intraday. Speed matters; the signal is time-sensitive and a limit order may not fill before the move extends.
Trend, reversal, and pullback entries use next-day opens or limit orders set the evening before. These setups benefit from overnight confirmation and avoid the noise of intraday execution.
Breakout entries can use either: market order on the break candle for entries with very strong volume confirmation, or limit order at the retest level for entries where the trader prefers to wait for the pullback-and-hold confirmation.
Best Entry Type by Market Regime
Bull market (SPY above 200-day MA):
Pullback entry produces the highest win rates. Trend entry is the second choice. Reversal entry works at significant support levels. Momentum entry is less necessary when the trend provides directional clarity.
Bear market (SPY below 200-day MA):
Reversal entry for short bounces from resistance (using the same mechanics inverted). Breakout entry below support levels for short entries. Momentum entry for sharp acceleration moves.
Choppy/sideways market:
Momentum entry for short-term acceleration plays. Reversal entry at the extremes of the range. Breakout entry is unreliable in choppy markets, as false breakouts are frequent.
Post-consolidation (tight range breaking out):
Breakout entry is the primary choice. Momentum entry on the expansion candle as a secondary signal.
Before earnings or major scheduled events:
All entry types carry elevated gap risk. Reduce position size to 50% of normal or skip entirely.
PART 8: COMBINING ENTRY TYPES FOR HIGHER WIN RATES
Using two entry types that independently confirm the same setup increases historical win rates by 6-10 percentage points.
Trend + Reversal
Setup: Price is in an established uptrend (trend entry criteria met) AND has pulled back to a support level where a reversal candle has formed (reversal entry criteria met).
The trend provides directional context. The reversal candle at support provides timing precision. Both signals pointing at the same entry is stronger evidence than either alone.
Applied to the AAPL February 2024 example:
- Weekly trend confirmed (above 20-week EMA, both MAs rising)
- Daily trend confirmed (above 20-day EMA)
- Price pulled back to 20-day EMA
- Hammer candle formed at the EMA level
- Volume increased on the bounce candle
When both the trend and reversal criteria are met simultaneously, the setup warrants full position size. Historical win rate on this combination: approximately 68%. Profit factor: approximately 2.6.
Trend + Momentum
Setup: Established uptrend with a momentum indicator accelerating as price enters a new leg higher.
The trend confirms direction. The momentum acceleration confirms timing: the signal fires when buying pressure is increasing within an already-bullish structure, rather than just when price happens to be in an uptrend.
Historical win rate on this combination: 64-71%.
Reversal + Momentum
Setup: Price bounces from a confirmed support level (reversal criteria) AND a momentum indicator crosses above its threshold on the bounce candle (momentum criteria).
The support level provides the structural reason for the trade. The momentum crossover on the bounce candle provides the precision entry signal. Two independent data points agreeing on the same moment.
Historical win rate on this combination: 62-69%.
PART 9: HOW TO SELECT YOUR ENTRY TYPE
The Decision Process
Step 1: Check the market regime. Apply the Pillar 1 market regime framework: SPY relative to the 200-day MA, VIX level, market breadth.
- Bull market (SPY above 200-day MA): pullback or trend entry
- Bear market (SPY below 200-day MA): reversal or breakout (short entries)
- Choppy/sideways: momentum or reversal
Step 2: Check the stock's trend. Independent of the market regime, what is this specific stock doing?
- Established uptrend with consistent higher highs: pullback or trend entry
- Consolidating in a tight range: breakout entry
- Sharp recent decline to a support level: reversal entry
Step 3: Check current price action. What is price doing right now?
- Pulling back within an uptrend: pullback entry
- Bouncing off a support level: reversal entry
- Accelerating with volume: momentum entry
- Breaking through a prior resistance level: breakout entry
The entry type that is consistent across all three steps (market regime, stock trend, and current price action) is the correct one for the setup.
Pre-Trade Checklist
Before any entry (applies across all five entry types):
- Market regime identified (bull/bear/choppy)
- Stock trend direction confirmed on weekly chart
- Entry type matches both market regime and stock trend
- Higher timeframe (weekly) does not conflict with entry timeframe (daily) setup
- Volume criteria met for the specific entry type
- Candlestick confirmation present where required
- Confluence score from Pillar 1 framework: 14+/19 points
- Position size calculated at 1% account risk
- Stop and target levels set before entry
- R:R at 2:1 minimum (3:1 for high-confluence reversal setups)
- Economic calendar checked for events in the next 3 days
- Stop-market order placed immediately at entry
PART 10: COMMON ENTRY MISTAKES ACROSS ALL TYPES
Using the wrong entry type for the market regime. Applying a trend entry in a choppy sideways market produces a high frequency of failed bounces. Applying a breakout entry in a choppy market produces frequent fakeouts. The first filter before any trade is market regime: it determines which entry types are viable.
Entering without higher timeframe confirmation. A daily setup that conflicts with the weekly trend fails at a rate that overwhelms the signal quality of the daily setup alone. The weekly chart check is not optional and takes less than 30 seconds.
Ignoring volume requirements. Every entry type has a specific volume condition. Breakouts require 160%+ average. Reversal and momentum signals require 120%+ on the confirmation candle. Pullback entries require decreasing volume on the pullback and increasing volume on the bounce. A setup that meets all other criteria but fails the volume condition is not a complete signal.
Chasing entries. Entering three or four candles after the signal candle produces entries further from the stop and closer to potential resistance. The risk:reward ratio of the setup is calculated based on the signal candle's price, not a later entry. A missed entry is either a skip or a wait for the next setup, not a reason to enter at a worse price.
Position sizing by feel. "This setup looks strong" is not a position sizing methodology. A 19/19 confluence score on a pullback entry in a strong bull market does not justify risking 5% of account on the trade. The 1% rule applies uniformly regardless of signal quality. A single loss at 5% risk undoes five trades at 1% risk that all went to target.
Holding through scheduled news. Earnings reports and major economic releases (Fed decisions, CPI prints, payroll reports) introduce gap risk that can stop out a valid setup on information completely unrelated to the entry signal. Check the economic calendar before opening any position. If a scheduled release falls within the hold period, either skip the trade or reduce position size.
FINAL THOUGHTS: ENTRY TYPE MASTERY
The question before any trade is not "which indicator should I use?" It's "which entry type matches this market condition, this stock's trend, and this specific price action?"
The entry type determines the edge. Indicators are the measurement tools used to confirm the setup, useful but secondary to getting the entry type right.
A pullback entry in a choppy market with no defined trend will fail regardless of which indicators confirm it. The same pullback entry in a strong bull market with weekly trend confirmation has a 61-69% historical win rate. The difference is not the indicators. It's the match between entry type and market condition.
Master one entry type before adding a second. Apply the Pillar 1 confluence framework to score each setup. Execute with fixed 1% position sizing. The win rate improvement from a correctly applied entry type in the right market regime exceeds anything achievable through indicator selection.
GLOSSARY
ATR (Average True Range): Volatility measure showing average price movement over a given period. Used for stop placement and to assess whether a stock moves enough to reach 2:1 targets within a reasonable hold.
EMA (Exponential Moving Average): Moving average weighting recent prices more heavily than older prices. More responsive than a simple moving average to recent price changes.
Fibonacci Retracement: Price levels where pullbacks commonly stabilize, based on the Fibonacci sequence: 38.2%, 50%, and 61.8% of the prior move are the most frequently referenced levels.
MACD (Moving Average Convergence Divergence): Momentum indicator using the difference between two exponential moving averages (typically 12 and 26 periods). Histogram turning positive signals momentum acceleration.
RSI (Relative Strength Index): Momentum oscillator (0-100 scale). Readings above 70 indicate overbought conditions; below 30 indicate oversold. Crossings of the 50 level signal directional momentum shifts.
TSI (True Strength Index): Double-smoothed momentum indicator. More responsive than RSI with fewer false signals. Signal line crossovers are the primary entry trigger in momentum and reversal setups.
Volume Profile: Distribution of trading volume across price levels. Shows where most historical trading activity has occurred, which indicates where institutional support and resistance are likely to be strongest.
VWAP (Volume Weighted Average Price): The average price of a security weighted by volume throughout the trading session. Often used as an intraday support/resistance level.
NEXT STEPS
Each entry type covered in this guide maps directly to a strategy guide with fully backtested systems. Choose the guide that matches your entry type and current market regime.
Momentum + Reversal Entry
Momentum Reversal Strategies: How to Catch Sharp Oversold Bounces (Without Catching Falling Knives)
www.breakoutbulletin.com/article/momentum-reversal-strategies-oversold-bounces
11 systems, win rates 45-65%. Best in choppy and volatile markets.
Trend + Pullback Entry
The Ultimate Trend Following Guide: 14 Systems to Trade Pullbacks with Edge
www.breakoutbulletin.com/article/rules-based-trend-following-guide
14 systems, win rates 52-68%. Highest win rates in the full catalog. Best in confirmed bull markets.
Breakout + Momentum Entry
Volatility Breakout Strategies: The Complete Guide to Trading Explosive Moves
www.breakoutbulletin.com/article/volatility-breakout-strategies-hub-3-guide
6 systems, win rates 50-62%. Best after post-consolidation squeeze patterns.
Momentum + Volume Entry
8 Rules-Based Volume Trading Strategies for Tracking Institutional Flows
www.breakoutbulletin.com/article/rules-based-volume-trading-strategies
8 systems, win rates 48-64%. Works across all market regimes. Tracks institutional accumulation before price moves.
Reversal Entry
Mean Reversion Quick-Start Guide: The 5 Rules for Trading Oversold Bounces
www.breakoutbulletin.com/article/mean-reversion-quick-start-guide
5 systems, win rates 52-62%. Best in sideways and choppy markets.
Foundation Guides
How to Build a Profitable Trading System From Scratch: The Complete Rules-Based Guide
www.breakoutbulletin.com/article/how-to-build-profitable-trading-system
The 19-point confluence framework and position sizing rules that underpin every entry type in this guide.
Algorithmic Trading Systems Library: 46 Quant-Based Backtested Systems for Any Market Regime
www.breakoutbulletin.com/article/rules-based-stock-trading-strategies-library
The full strategy catalog. Compare all 46 systems by win rate, profit factor, and market regime.
LEGAL DISCLAIMER
This guide is provided for educational purposes only. It is not financial advice or investment recommendations. Past performance does not guarantee future results. All trading involves substantial risk of loss. Backtested results are hypothetical and do not reflect actual trading. Win rates and profit factors shown are from historical testing and may not be achievable in live markets. Consult a licensed financial advisor before making any trading decisions.