
BreakoutBulletin | BB Macro Intelligence Series
Part of the Macro Intelligence Master Guide
Educational commentary only. Not investment advice.
The Market Move That Confuses Investors
A pattern repeats across market cycles. Interest rates rise and technology stocks fall. The Federal Reserve signals tighter policy and high-growth companies start sliding. Meanwhile, banks or industrial companies hold steady or move higher.
To many retail investors, this reaction feels disconnected. Why should a small move in interest rates affect companies building software, artificial intelligence infrastructure, or cloud platforms?
The answer sits in something deceptively simple: how the market values future earnings.
How Stocks Are Actually Valued
Every stock represents a stream of future profits. Those profits may arrive next quarter, next year, or many years out. But investors don't treat future dollars as equal to today's dollars.
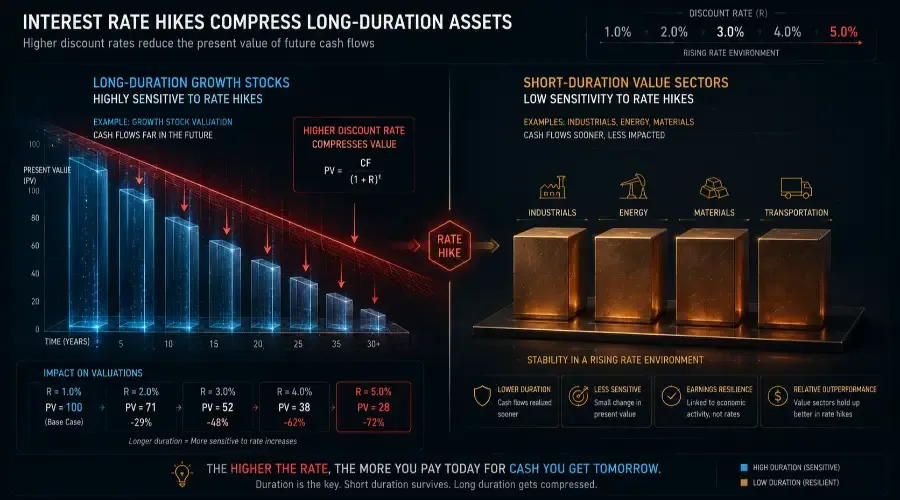
They apply a discount rate. That rate is shaped by the broader macro environment, which determines how markets price risk and growth. A dollar earned ten years from now is worth less than a dollar earned today. Interest rates determine how heavily those future earnings are discounted.
When interest rates rise, future profits become less valuable in present terms. That compression is the mechanism behind most rate-driven selloffs in growth stocks. It's also why understanding interest rates sits at the foundation of the Market Regime Identification Framework: the rate environment shapes which stock groups are likely to attract capital and which face structural headwinds.
Why Growth Stocks Are Especially Sensitive
Growth companies, particularly in technology, generate much of their expected profit far into the future. Businesses building AI infrastructure, new software platforms, biotech treatments, and digital ecosystems typically reinvest heavily today to grow rapidly over the next five to ten years. This long-dated profit profile makes their valuations highly sensitive to changes in the discount rate – the same math explored above.
This sensitivity becomes clearer when interest rates are placed within a structured system that combines macro conditions, market internals, and price action, rather than treated as a standalone variable. That process is detailed in the Daily Market Analysis Framework.
A Simple Way to Think About It
Consider two companies:
- Company A earns strong profits today
- Company B generates most of its profits several years from now
When interest rates rise, Company B is affected more. Its value depends on distant earnings, which are now discounted more aggressively. In the stock market, Company B is almost always the growth stock.
Seeing the Math: How Discount Rates Change Value
The concept becomes concrete with actual numbers. Here is how the same future profit stream values differently at different interest rate levels:
| Discount Rate | Value of $100 earned in 10 years (today's dollars) |
|---|---|
| 2% | $82.00 |
| 4% | $67.60 |
| 6% | $55.80 |
| 8% | $46.30 |
At a 2% discount rate, the market pays $82 today for that future $100. At 8%, only $46.30. The same company, the same business prospects, a different rate environment. A move from 2% to 8% cuts the estimated present value nearly in half without any change in the underlying business.
The Long-Duration Stock Concept
Professional investors describe growth stocks as long-duration assets. The term comes from bond markets, where duration measures how sensitive a bond's price is to changes in interest rates. Assets whose value depends heavily on distant cash flows carry long duration.
Growth stocks behave the same way. When interest rates rise, long-duration assets fall more. Short-duration assets fall less.
In practical terms:
- High-growth technology stocks react sharply to rate increases
- Mature, cash-generating companies with near-term earnings are less sensitive
Many professional traders classify stocks based on how they respond to macro forces like interest rates, currency, and economic cycles. That classification system is covered in the Sorting Hat for Stocks framework.
The Duration Spectrum
Different sectors fall at different points along the duration spectrum:
| Duration Profile | Sectors | Rate Sensitivity |
|---|---|---|
| Short duration | Energy, Industrials, Staples | Less affected by rate moves |
| Medium duration | Utilities, Consumer Discretionary | Moderate sensitivity |
| Long duration | Technology, Biotech, AI platforms | Most affected by rate moves |
Companies on the short end generate profits now. Companies on the long end promise profits later. Their position on this spectrum determines how sensitive they are to interest rate changes.
The Sectors Most Exposed to Interest Rates
| Sector | Typical Rate Sensitivity | Why |
|---|---|---|
| Information Technology | High | Valuations tied to distant earnings; long-duration profile |
| Consumer Discretionary | High | Demand sensitive to borrowing costs; growth expectations embedded |
| Communication Services | High | Platform companies trade on future scale |
| Utilities | Medium | Bond proxy, but regulated returns provide some stability |
| Consumer Staples | Medium | Steady cash flows, but valuations can still compress |
| Industrials | Lower | Tied to current economic activity; less duration |
| Energy | Lower | Driven by commodity prices and current demand |
| Financials | Mixed | Two opposing forces at work (see below) |
Why Financials read as mixed: Banks face two opposing forces when rates rise. Higher rates can improve net interest margins, the profit spread on loans, which is positive. But rising rates can also slow loan demand and increase default risk. The balance between these forces determines whether financials rise or fall in any given rate-hike cycle.
This sector-level behavior connects directly to the commodity cycle, which often shifts market leadership toward energy and industrial stocks during expansion phases. That dynamic is explained in Why Commodity Booms Lift Cyclical Stocks.
The Earnings Yield Connection
Investors constantly compare stocks and bonds. This comparison drives much of the rotation between asset classes.
When the 10-year Treasury yield rises, it creates competition for equity capital. Consider a growth stock trading at 40x earnings. Its earnings yield, the inverse of the P/E ratio, calculates as:
Earnings Yield = 1 ÷ 40 = 2.5%
Of course, if earnings are projected to grow rapidly, the forward earnings yield may quickly exceed the bond yield, but the current snapshot comparison still sways asset allocation decisions.
If the 10-year Treasury yield rises to 5%, a risk-free government bond pays twice as much as the earnings yield on that stock. Investors reassess: why accept stock market risk for half the return? That reassessment accelerates selling in high-multiple growth stocks when rates rise, and drives buying when rates fall.
This relationship between bond yields and equity valuations is one of the primary signals traders track in the pre-market routine because it frequently sets the tone for sector rotation before the open.
When Rising Rates Don't Hurt Stocks
Rate increases don't always trigger market declines. Context matters.
Rates sometimes rise because the economy is strengthening. In those cases, corporate earnings may be improving, demand may be accelerating, and commodity markets may be expanding. Cyclical sectors, including energy, industrials, and materials, can benefit from those conditions even as growth stocks face valuation pressure.
This is why market reactions to rate moves sometimes appear inconsistent. The rate itself matters. The reason the rate is rising matters more. A rate hike driven by strong economic growth carries different implications than a rate hike driven by persistent inflation. The Market Regime Identification Framework addresses this distinction directly, using credit spreads, VIX levels, and market internals to classify which type of rate environment is actually active.
Three Common Mistakes
Mistake 1: Selling every growth stock the moment the Fed hints at a rate hike.
Markets are forward-looking. They price in expected rate moves long before they happen. If a rate hike is already anticipated and reflected in stock prices, growth stocks may not fall when the hike is announced. They may even rally if the forward guidance improves.
Mistake 2: Assuming all rate hikes are bad for stocks.
Rate hikes driven by strong growth can be neutral or positive for cyclical and value sectors. The economic context determines the impact. Currency movements add another layer: a strong dollar can amplify or offset the impact of rising rates on earnings, particularly for multinationals, as covered in How a Strong Dollar Affects the S&P 500.
Mistake 3: Ignoring the starting point.
The move from 1% to 2% affects valuations more dramatically than the move from 5% to 6%. Low-rate environments create high duration sensitivity. The same rate increase has a larger mathematical impact when the starting rate is near zero.
How Investors Use This Insight
Professional investors rarely react to interest rates alone. They watch how rates interact with other macro variables: inflation expectations, economic growth, credit conditions, and commodity prices. When several signals align, sector rotations tend to follow.
| Environment | Typical Sector Response |
|---|---|
| Rising rates + Strong economic growth | Industrials, Energy, Materials benefit |
| Rising rates + Slowing growth | Defensive sectors (Staples, Utilities) hold |
| Falling rates + Slowing growth | Long-duration Growth (Tech) outperforms |
| Falling rates + Strong growth | Broad market strength; Cyclicals lead |
The key idea is straightforward. Different sectors thrive in different macro environments. The Sorting Hat frameworkmaps this directly, grouping stocks by which macro force drives their performance most.
What to Watch When Interest Rates Move
When bond yields trend higher, the questions worth asking are:
For example, if the 10-year yield climbs from 4% to 4.5% following a strong employment report, the driver is likely growth optimism. That same move triggered by an inflation scare would have different sector implications. The following questions help distinguish between these dynamics.
- Is the move driven by inflation expectations or real growth?
- Is the economy accelerating or slowing alongside the rate move?
- Are financial conditions tightening meaningfully?
- Which sectors historically respond to this specific combination?
Those questions translate macro signals into sector insights. They also inform how to size positions during the transition period, which the Daily Market Analysis Framework covers through its position sizing rules aligned to signal quality.
Key Takeaways
| Concept | Summary |
|---|---|
| Discounting | Future earnings are worth less in today's dollars when rates rise |
| Duration | Growth stocks are long-duration assets – highly rate-sensitive |
| Magnitude | The same $100 future profit is worth $82 at 2% rates, $46 at 8% rates |
| Context | Rate hikes driven by growth affect markets differently than hikes driven by inflation |
| Earnings Yield | Stocks compete with bonds; rising bond yields make high-multiple stocks less attractive |
| Portfolio | Diversifying across duration profiles reduces sensitivity to rate cycles |
Go Deeper: BB Macro Intelligence Series
- The Sorting Hat for Stocks – Master guide to all four macro stock groups
- Market Regime Identification Framework – Classify the current macro environment
- Daily Market Analysis Framework – Apply macro signals in a structured daily process
- Bond Yields vs Stock Market – How yield movements translate into equity valuations
Explore the full series at breakoutbulletin.com.
This article is produced by BreakoutBulletin for educational purposes only. It does not constitute investment advice or a recommendation to buy or sell any security. Market relationships between interest rates and sector performance vary across economic cycles and should be interpreted in context. BreakoutBulletin is an educational content platform and is not a registered investment advisor, broker-dealer, or financial institution.