
BreakoutBulletin | BB Trading Frameworks Series
Part of the 5-Layer Trading Framework Master Guide
Educational commentary only. Not investment advice.
The Problem Is Integration, Not Information
Most intermediate traders don't struggle because they lack knowledge. They already understand that rising interest rates compress growth valuations, that defensive sectors outperform when uncertainty rises, and that charts reveal support and resistance levels.
What breaks down is integration. One signal says the setup is there. Another says the macro environment isn't right. A third suggests waiting for confirmation. Without a structured process connecting these inputs in a consistent sequence, even accurate analysis produces inconsistent results.
This framework is the integration layer. It connects macro regime identification, market internals, capital flow analysis, stock selection, and price action into a single daily process. The sequence is fixed: macro defines the environment, internals confirm participation, capital flow identifies the sector, stock selection narrows the field, and price action provides the trigger.
Regime classification is reviewed weekly; internals and sector flows are checked daily; price triggers are evaluated intraday or at the close. This cadence prevents over-reaction to short-term noise while keeping the analysis aligned with the current environment.
Understanding the Market Regime Identification Framework before applying this process is strongly recommended – the regime classification informs every downstream step.
The Framework Sequence
1. Classify the Macro Environment
Analyze the VIX, high-yield credit spreads, and the yield curve to determine if the active regime is risk-on, risk-off, or transitional.2. Confirm Through Market Internals
Check the Advance-Decline line, volume ratios, and the percentage of stocks above their 200-DMA to verify that broad participation matches the macro thesis.3. Identify Capital Flows
Track sector ETF relative strength over 5 and 20 sessions to see where institutional money is moving in real time.4. Narrow to Individual Stocks
Screen the leading sectors for balance sheet strength, upward earnings revisions, and institutional accumulation volume.5. Execute with Price Action
Use moving averages, VWAP zones, and structural reclaims on high volume to trigger and size the trade.
Step 1: Classify the Macro Environment
Before analysing any stock or sector, the starting question is the same every session: what kind of market environment is currently active?
The regime classification draws on five inputs: VIX level and direction, high-yield credit spreads, the percentage of stocks above their 200-day moving average, advance-decline line behaviour, and how the market reacts to economic data.
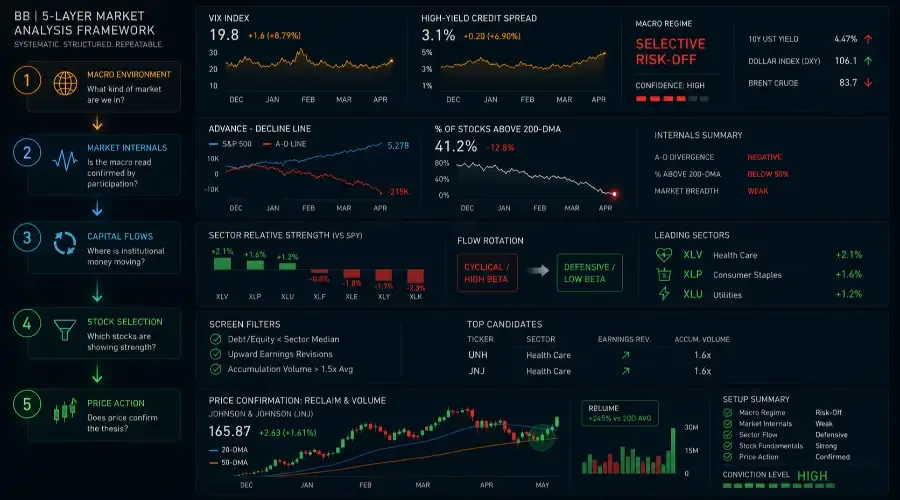
As of April 2026, the evidence points toward a selective risk-off environment. The 10-year Treasury yield is trading above 4.4%, creating pressure on long-duration growth stocks through the discount rate mechanism covered in Why Rising Interest Rates Hurt Growth Stocks . The dollar is holding near 106, tightening global liquidity for multinational companies – the earnings translation effect explained in How a Strong Dollar Affects the S&P 500 . VIX has been trading in the 18–22 range. High-yield credit spreads have widened from 2.9% to 3.1% over the past month.
This combination does not signal a market collapse. It signals a transition – and in transitional environments, the market rewards selectivity rather than broad directional exposure.
Selective risk-off sits between full risk-on (VIX below 15, credit spreads tight, broad participation) and full risk-off (VIX above 30, spreads above 5%, defensive sectors only). It is characterised by narrowing leadership and early credit deterioration without a systemic panic.
Regime classification checklist:
| Signal | Current Reading (April 2026) | Regime Implication |
|---|---|---|
| VIX | 18–22, mildly rising | Selective risk-off |
| High-yield credit spreads | 3.1%, up from 2.9% | Selective risk-off |
| % stocks above 200-DMA | Below 45% | Selective risk-off |
| Advance-decline line | Diverging from index | Selective risk-off |
| Market reaction to bad news | Outsized negative reactions | Selective risk-off confirmed |
For the “Market reaction to bad news” signal, outsized negative reactions can be quantified as intraday S&P 500 drawdowns exceeding 1% following negative economic surprises when the index is already below its 50-day moving average.
Step 2: Confirm Through Market Internals
Macro analysis describes what should be happening. Market internals confirm whether it actually is.
In the current environment, internals are not confirming broad strength. The advance-decline line has been diverging from index performance for six consecutive weeks – fewer stocks are participating in upward moves even as the index holds broadly stable. The percentage of stocks above their 200-day moving average has dropped below 45%, while fewer stocks are holding above their 50-day average on a short-term basis.
Sentiment measures add another layer. A put-call ratio below 0.80 is consistent with risk-on behaviour. Above 1.10, fear begins to dominate. The current reading, combined with VIX near or above 20, reinforces a cautious tone.
Credit market behaviour provides the earliest signal. Spreads compressing below 3.5% are supportive. The move from 2.9% to 3.1% appears small in absolute terms but reflects a directional shift in institutional risk appetite. Credit markets historically lead equity prices at turning points.
Volume confirms or contradicts the price picture. When advancing volume is at least 1.5 times declining volume, participation is broad. When declining volume dominates, index stability is misleading – the underlying market is weaker than the headline number suggests.
Internals checklist:
| Internal Signal | Risk-On Reading | Current Reading | Implication |
|---|---|---|---|
| Advance-decline line | Rising with index | Diverging 6 weeks | Selective risk-off |
| % stocks above 200-DMA | Above 55% | Below 45% | Selective risk-off |
| % stocks above 50-DMA | Above 50% | Declining | Weakening |
| Put-call ratio | Below 0.80 | Approaching 1.00 | Caution building |
| Advancing/declining volume | Above 1.5:1 | Below 1:1 | Distribution |
| HY credit spread direction | Compressing | Widening | Risk-off signal |
Step 3: Identify Where Capital Is Flowing
Once macro and internals align, the next step is identifying where institutional capital is actually moving – not where it should move in theory, but where price and volume data confirm it is moving now.
In a selective risk-off environment, the rotation pattern is predictable: capital moves from long-duration growth stocks toward defensive sectors. In April 2026, Healthcare, Consumer Staples, and Utilities are showing sustained outperformance against a flat or weakening index. Structural rotation – multiple defensive sectors moving together across three or more consecutive sessions – signals institutional repositioning, not tactical noise.
The sector rotation pattern connects directly to the four-house framework in the Sorting Hat for Stocks. In a selective risk-off environment, Hufflepuff (defensives) attracts capital while Gryffindor (long-duration growth) faces headwinds. Ravenclaw (cyclicals) depends on commodity price direction. Slytherin (multinationals) is shaped primarily by dollar strength, which at 106 is creating translation headwinds for companies with significant international revenue.
Rotation signals to track daily:
- Sector ETF relative strength vs SPY over 5 and 20 sessions
- New 20-day highs concentrated in defensive vs cyclical sectors
- Sector ETF volume relative to 20-day average (above 1.3x average confirms institutional flow)
- Whether the rotation has persisted for 3 or more consecutive sessions
Step 4: Narrow to Individual Stocks
With the sector identified, the analysis narrows to a small group of stocks aligned with both the macro environment and observed sector flows.
Three screening filters apply in sequence.
Balance sheet strength – Screen for debt-to-equity below the sector median. This automatically excludes the most leveraged names, reducing refinancing risk in a rising-rate environment. Companies carrying disproportionate leverage face compressing margins even if their revenues hold.
Earnings revision direction – Stocks with at least two upward earnings revisions in the past 30 days, or no downward revisions, show alignment with institutional expectations. Downward revisions in a selective risk-off environment accelerate selling; upward revisions provide relative support.
Volume accumulation pattern – When volume on flat or mildly declining days rises to 1.5 times the 20-day average while price holds steady, it historically indicates institutional accumulation occurring below the surface. This signal is the most actionable of the three because it reflects actual buying behaviour rather than a screening metric.
Step 5: Execute With Price as the Final Confirmation
By the time price action enters the process, most of the analytical work is complete. The regime is classified. Internals confirm it. The sector is identified through flow data. The stock is screened for balance sheet strength, earnings direction, and accumulation.
Price provides the trigger, not the thesis.
Prior highs and lows, the 20-day and 50-day moving averages, and volume-weighted average price zones act as confirmation points. When price reclaims a level on expanding volume, in alignment with the macro thesis and sector flow, the setup carries confirmation from multiple independent inputs. For example, a close above the 20-day moving average on volume at least 20% above the 20-session average, following a sector rotation signal of three or more consecutive sessions, provides a concrete confirmation point.
Position sizing by signal alignment:
| Signal Alignment | Position Size | Rationale |
|---|---|---|
| Macro + internals + sector + price all aligned | Full size | Four independent inputs confirm; highest follow-through probability |
| 3 of 4 aligned | 60–70% of normal | One input is missing or ambiguous |
| 2 of 4 aligned | 40–50% of normal | Conflicting signals; environment is transitioning |
| Signals conflicting | 25% or wait | Transition phase; preserve capital until alignment improves |
Conflicting signals are not failures of the framework. They indicate a regime transition where the old environment is losing strength before a new one is established. Reducing size during transitions is the structured response, not a workaround.
Every trade placed should connect back to the macro view established in Step 1. A setup that doesn't align with the macro regime introduces inconsistency – and inconsistency compounds over time into the hesitation and frustration that most intermediate traders experience.
April 2026 Walkthrough: A Real Session
The 10-year yield rises 6 basis points to 4.47%. The dollar strengthens 0.4% to 106.1. VIX moves to 19.8 and trends higher through the session. High-yield credit spreads widen 12 basis points intraday. The advance-decline line weakens even as the index holds broadly stable.
Step 1 – Regime: Selective risk-off confirmed. Yield move is driven by inflation expectations, not growth optimism. Dollar strength at 106.1 adds translation headwinds for multinationals.
Step 2 – Internals: Advance-decline divergence persisting. Volume data shows declining volume at 1.4 times advancing volume. Put-call ratio at 0.98 – caution building but not fear-dominant.
Step 3 – Capital flow: Healthcare and Consumer Staples outperforming for the fourth consecutive session. Energy flat despite oil above $100 – commodity sector not attracting incremental flows today.
Step 4 – Stock selection: Within Healthcare, UnitedHealth (UNH) and Johnson & Johnson (JNJ) both show volume at approximately 1.6 times the 20-day average while price holds stable near the 50-day moving average. Debt-to-equity below sector median. No downward earnings revisions in the past 30 days. Not every healthcare stock will meet these accumulation criteria; the screening process typically yields only a handful of names, reinforcing the framework’s emphasis on selectivity.
Step 5 – Execution: Macro and internals aligned. Sector confirmed through three-session flow data. Both stocks show accumulation patterns. Price reclaims the 20-day moving average with strong volume on the next session. Full position size is consistent with the four-input alignment.
This is not prediction. It is a structured process applied consistently.
When the Framework Produces Conflicting Signals
No analytical process works cleanly in all conditions. Three specific situations produce conflicting signals that warrant reduced exposure or a pause.
Liquidity shocks – March 2020 is the reference case. Price moved faster than macro signals could adjust. Credit spreads spiked. Gold and bonds fell alongside equities. In genuine liquidity stress, reducing exposure and raising cash is the appropriate response. The framework is designed for trending regimes, not liquidity crises.
Geopolitical supply shocks – The 2022 Russia-Ukraine energy shock created a selective risk-on environment for energy while simultaneously creating risk-off conditions for growth. Standard regime classification produces ambiguous signals during supply shocks because the commodity and rate effects pull in opposite directions simultaneously. Reducing overall size and focusing only on the most clearly aligned sectors is the appropriate response.
Central bank surprise events – Unexpected rate decisions or forward guidance changes can override existing macro conditions within minutes. The Economic Calendar Trading Framework addresses how to handle these specific sessions, including why the first five minutes after a release are rarely the actionable window.
In all three cases, the correct response is the same: step back, reduce exposure, and wait for the signals to realign before sizing up again.
Key Takeaways
| Step | Input | What It Answers |
|---|---|---|
| 1 – Macro | VIX, credit spreads, % above 200-DMA, A-D line | What kind of market are we in? |
| 2 – Internals | Breadth, volume ratios, put-call ratio, sentiment | Is the macro read confirmed by participation? |
| 3 – Capital flow | Sector ETF relative strength, volume, persistence | Where is institutional money actually moving? |
| 4 – Stock selection | Balance sheet, earnings revisions, accumulation volume | Which stocks within the sector are attracting buyers? |
| 5 – Price action | Key levels, moving averages, volume on reclaim | Does price confirm the thesis? |
| Position sizing | Signal alignment count | How much exposure is appropriate right now? |
Go Deeper: Breakout Bulletin Trading Frameworks Series
- How to Read the Stock Market Like a Professional: The 5-Layer Framework – Master guide to the full trading framework
- Market Regime Identification Framework – Step 1 in depth: classifying the current environment with specific thresholds
- Risk-On vs Risk-Off Markets Explained – The conceptual foundation for regime classification
- Economic Calendar Trading Framework – How to apply this framework around CPI, NFP, and FOMC
- The Sorting Hat for Stocks – How macro environments map to stock groups across the S&P 500
- Why Rising Interest Rates Hurt Growth Stocks – The discount rate mechanism behind Step 1
- How a Strong Dollar Affects the S&P 500 – Dollar effects on Step 3 capital flow analysis
- Defensive Stocks Explained – How Hufflepuff stocks behave in the current selective risk-off environment
- Sector Rotation Strategy – How to track capital rotation through the daily analysis process
- Pre-Market Routine for Macro Traders – The step-by-step preparation process before Step 1 begins
- Bond Yields vs Stock Market – How daily yield moves feed into the Step 1 macro classification
- Stocks Rising While Market Falls – Identifying accumulation in individual stocks during broad weakness
This article is published by BreakoutBulletin for educational purposes only. It does not constitute investment advice or a recommendation to buy or sell any security. All market data, thresholds, and examples are provided for illustrative purposes only. Company names referenced in the April 2026 walkthrough are used as examples only and do not constitute recommendations. Past performance is not indicative of future results. BreakoutBulletin is an educational content platform and is not a registered investment advisor, broker-dealer, or financial institution.
© 2026 BreakoutBulletin | breakoutbulletin.com | All rights reserved.