
BreakoutBulletin | BB Macro Intelligence Series
Part of the Macro Intelligence Master Guide
Educational commentary only. Not investment advice.
The Market Move That Many Investors Miss
Financial headlines focus on stock prices, interest rates, and oil. Currency markets run in the background – rarely dominating financial news, yet consistently influencing the earnings of hundreds of S&P 500 companies.
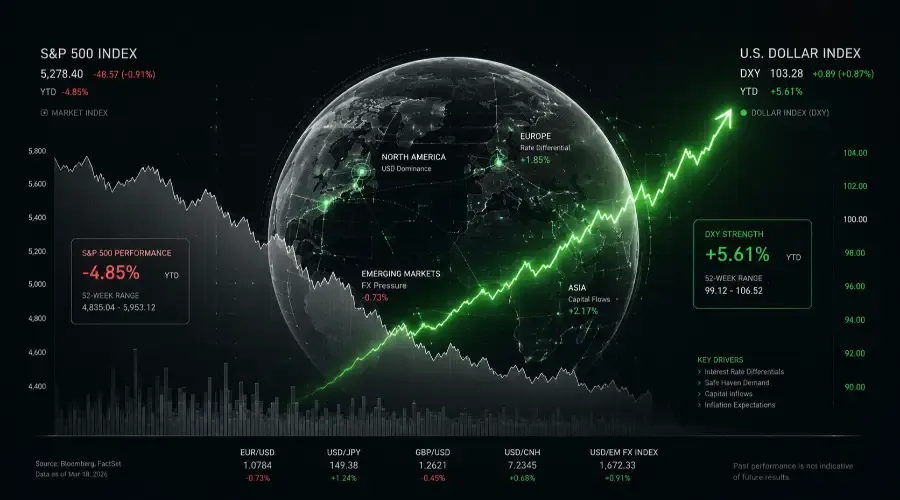
For many multinational businesses, currency movements affect reported profits almost as much as changes in underlying demand. In 2022, dollar strength reduced S&P 500 earnings by roughly 5%, equivalent to wiping out an entire quarter's growth for many companies.
Understanding this mechanism explains why certain sectors outperform during periods of dollar strength and why others struggle – and connects directly to the macro classification framework in the Sorting Hat for Stocks, where global multinationals sit in House Slytherin precisely because of this currency sensitivity.
Why the Dollar Matters for Corporate Earnings
Many large American companies generate a significant share of revenue outside the United States: beverages, pharmaceuticals, consumer goods, industrial equipment, and technology hardware firms all sell across dozens of countries. Most report financial results in U.S. dollars, even though a large portion of their sales occur in foreign currencies.
That creates a translation effect. When foreign revenue converts back into dollars, exchange rates determine how large those revenues appear on financial statements.
Dollar strength interacts with interest rates, liquidity, and global capital flows. When rate differentials widen between the U.S. and other economies, capital flows into dollar assets, strengthening the currency. That sequence connects currency analysis directly to the rate environment covered in Why Rising Interest Rates Hurt Growth Stocks.
The Three Channels: How Currency Moves Affect Earnings
Currency impacts arrive through three distinct channels.
Translation Effect
Foreign revenue converts at current exchange rates. A stronger dollar produces fewer dollars from the same volume of sales. This impact is immediate and visible in every earnings report.
Transaction Effect
Companies that manufacture in the U.S. and sell abroad face a pricing challenge when the dollar strengthens. The effect depends on whether the company prices in dollars and the local competitive landscape; many multinationals produce locally or price in local currency, mitigating the transaction impact. When the dollar strengthens and a company prices in dollars, its products become more expensive for foreign buyers, which can reduce demand volume over subsequent quarters.
Economic Effect
Broader currency moves shift global trade flows, capital investment decisions, and the pricing power of multinational firms across markets. For instance, a sustained strong dollar can make U.S. manufacturing less cost-competitive, accelerating the shift of production offshore. This channel unfolds over years rather than quarters.
The Currency Translation Effect: The Numbers
A U.S. company selling products in Europe collects revenue in euros but reports earnings in dollars. If the company earns €1 billion in revenue and the exchange rate is $1.10 per euro, that converts to $1.1 billion. If the dollar strengthens to $1.00 per euro, the same €1 billion converts to $1.0 billion. The company sold the same volume of product. Demand did not change. Reported revenue declines purely from exchange rate movement.
How Much Does a Dollar Move Actually Matter?
The relationship is not one-to-one. A 10% dollar strengthening does not produce a 10% earnings decline.
| Dollar Move | Impact on Foreign Revenue | Example |
|---|---|---|
| +10% | -9.1% | €100M revenue reports as $91M instead of $100M |
| -10% | +11.1% | €100M revenue reports as $111M instead of $100M |
Formula: Impact = 1/(1 + change) − 1
For a company with 50% international revenue, a 10% dollar rally reduces total reported revenue by roughly 4.5% before any demand effects are factored in.
Which Sectors Carry the Most Exposure
Some sectors of the S&P 500 are far more exposed to currency fluctuations than others. The figures below reflect typical foreign revenue percentages based on FactSet and S&P data.
| Sector | International Exposure | Typical Foreign Revenue % | Examples |
|---|---|---|---|
| Information Technology | High | 50–60% | Apple, Microsoft, NVIDIA |
| Consumer Staples | High | 40–50% | Procter & Gamble, Coca-Cola |
| Health Care | High | 40–50% | Johnson & Johnson, Pfizer |
| Industrials | Medium | 30–40% | Caterpillar, 3M |
| Materials | Medium | 30–40% | Dow, Ecolab |
| Financials | Lower | 15–25% | JPMorgan, Goldman Sachs |
| Utilities | Low | Below 10% | NextEra, Duke Energy |
A 10% dollar rally can reduce reported earnings growth by 3–4% for technology, health care, and consumer staples companies. Utilities and domestic service providers generate most revenue within the United States and experience limited currency impact.
Sector sensitivity to the dollar also overlaps with commodity cycle dynamics, where energy and materials companies respond differently depending on global demand conditions. That relationship is covered in Why Commodity Booms Lift Cyclical Stocks.
When the Dollar Weakens: The Tailwind Side
Currency effects operate in both directions. When the dollar weakens, foreign revenue converts into more dollars, increasing reported earnings. American products become cheaper for overseas buyers, which can stimulate demand.
In 2017–2018, a weakening dollar added roughly 2–3% to S&P 500 earnings growth, amplifying an already strong earnings environment. Multinational companies tend to outperform during prolonged periods of dollar weakness for this reason.
What Drives Dollar Cycles
Currency trends move in multi-year cycles, shaped by four primary forces:
- Interest rate differentials between countries
- Capital flows between global markets
- Economic growth expectations
- Commodity price movements
When U.S. interest rates rise faster than those in other economies, global capital flows into dollar assets, strengthening the currency. That sequence creates earnings headwinds for multinationals at the same time rising rates are compressing growth stock valuations – two reinforcing pressures that the Market Regime Identification Framework tracks simultaneously.
The most reliable leading indicator is the spread between 2-year U.S. and German yields. This differential historically leads dollar moves by three to six months.
Hedging: Why the Impact Is Not Always Immediate
Many multinationals hedge a portion of expected foreign revenue using derivatives, which reduces but does not eliminate currency impact. Companies typically hedge 3–12 months forward. A sudden dollar move affects unhedged exposure immediately. Hedged exposure appears with a lag as contracts roll off.
Where to find this data:
Many companies also disclose constant-currency revenue growth in their quarterly earnings press releases, providing the cleanest read on underlying demand. Quarterly 10-Q and annual 10-K filings include three specific disclosures: "Derivatives" footnotes showing hedging programs, "Constant Currency" reconciliations showing what earnings would have been without currency moves, and management discussion of expected FX impact in future quarters. Phrases like "FX headwind of 200 basis points" or "currency expected to drag Q3 revenue by 3%" quantify the impact directly.
What to Track During Dollar Moves
When the dollar begins trending strongly in either direction, four disclosures carry the most analytical weight:
- Revenue exposure by region (disclosed as percentages in annual 10-K filings)
- Foreign currency hedging strategies and duration
- Management commentary about FX impacts on forward guidance
- Changes in constant-currency growth rates quarter over quarter
These details reveal how currency moves are affecting real business results beneath the headline numbers. Integrating this currency analysis into the pre-market process – alongside yield curve data, credit spreads, and sector flows – is covered in the Daily Market Analysis Framework .
The Sorting Hat Connection
In the Sorting Hat framework, multinational companies fall into House Slytherin. These companies earn revenue across many currencies but report earnings in one. Their performance responds systematically to dollar direction: tailwind when the dollar weakens, headwind when it strengthens. Sensitivity varies by company due to hedging programs and local production footprints, so even within Slytherin, currency impact can differ meaningfully.
When the dollar weakens, House Slytherin benefits. When it strengthens, the environment for this group deteriorates. Viewing multinationals through this lens makes currency moves considerably easier to interpret within the broader macro classification system .
Where We Are Now: March 2026 Context
As of March 2026, the Dollar Index (DXY) trades near 99, down from its 2022 peak above 114 (Note: illustrative scenario based on recent trends). This weakening dollar has provided a translation tailwind to multinational earnings over the past 18 months. Technology and consumer staples companies have reported favorable currency effects.
The next direction of the dollar depends on the inflation trajectory. If inflation remains elevated, the Fed may hold rates higher for longer, supporting the dollar and creating renewed headwinds for multinationals. If inflation cools, rate cut expectations could weaken the dollar further, extending the tailwind. For portfolios with meaningful multinational exposure, the rate and inflation outlook matters as much as individual earnings reports.
Key Takeaways
| Concept | Summary |
|---|---|
| Translation Effect | Foreign revenue converts to fewer dollars when USD strengthens |
| Magnitude | A 10% dollar rally produces roughly a 9.1% reduction in foreign earnings |
| Sector Exposure | Tech, Staples, Health Care carry 40–60% international revenue |
| Hedging | Reduces impact but not immediately – check 10-K derivatives footnotes |
| Leading Indicator | 2-year yield spread (U.S. vs Germany) historically leads dollar moves by 3–6 months |
| Current Context | DXY near 99, down from 114 peak; inflation trajectory determines next leg |
Go Deeper: Breakout Bulletin Macro Intelligence Series
- The Sorting Hat for Stocks – Master guide to all four macro stock groups
- How to Read the Stock Market Like a Professional: The 5-Layer Framework – Regime identification, internals, and daily execution
- Why Rising Interest Rates Hurt Growth Stocks – How rate cycles interact with dollar strength
- Bond Yields vs Stock Market – How yield differentials drive dollar cycles
- Why Commodity Booms Lift Cyclical Stocks – The physical economy and sector leadership
- Defensive Stocks Explained – Where capital goes when uncertainty rises
- Market Regime Identification Framework – Classifying the current environment
- Daily Market Analysis Framework – Applying macro signals in a structured daily process
This article is produced by BreakoutBulletin for educational purposes only. It does not constitute investment advice or a recommendation to buy or sell any security. Currency movements affect sectors and companies differently across economic cycles and should be interpreted in context. All company examples and foreign revenue percentages are estimates based on publicly available data and provided for illustrative purposes only. BreakoutBulletin is an educational content platform and is not a registered investment advisor, broker-dealer, or financial institution.