
BreakoutBulletin | BB Trading Frameworks Series – Master Guide
Educational commentary only. Not investment advice.
This Series Covers
This is the master guide to the BB Trading Frameworks Series. Each article below covers one layer of the professional market reading process, from identifying the macro environment to executing trades around scheduled news events.
| Article | What It Covers | Where It Fits |
|---|---|---|
| Risk-On vs Risk-Off Markets Explained | The spectrum of market risk appetite | Foundation concept |
| Market Regime Identification Framework | How to classify the current environment | Step 1 of the daily process |
| Daily Market Analysis Framework | Macro, internals, and price action combined | Steps 2–5 of the daily process |
| Economic Calendar Trading Framework | How to trade CPI, NFP, and FOMC | Event-specific execution |
For the macro forces that shape these regimes, including interest rates, dollar strength, commodity cycles, and risk sentiment, start with the BB Macro Intelligence Series .
The Gap Between Knowledge and Process
Most intermediate traders have no shortage of information. They understand that rising rates compress growth valuations. They know defensive sectors outperform during recessions. They can read a chart and identify support and resistance levels.
What breaks down in practice is integration. One signal says the setup is there. Another says the macro environment isn't right. A third says wait for confirmation. Without a structured process that connects these inputs in a consistent sequence, even accurate analysis produces inconsistent results.
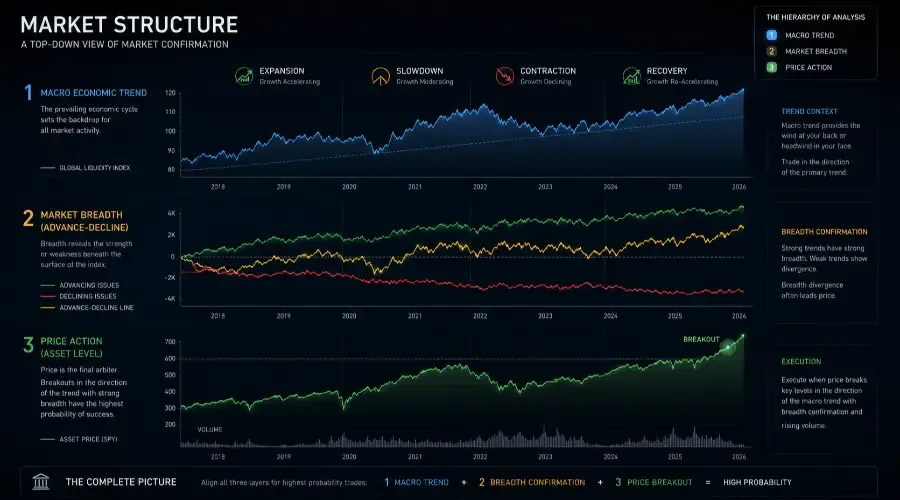
The four articles in this series address that gap. Together they form a layered system: understand the environment, confirm what the market is doing internally, identify where capital is flowing, then execute only when price confirms the thesis. This guide explains how the four layers connect and why the sequence matters.
Why Professional Traders Think in Layers
Retail traders typically start with a stock, whether a chart pattern, a news headline, or an earnings date, and work outward. Professional traders start with the environment and work inward.
The difference produces different outcomes. A trader who starts with a stock might identify a textbook breakout pattern, enter, and watch the trade fail because the broader market is in a risk-off regime where breakouts reverse. A trader who starts with the environment knows before looking at any chart whether the conditions support that kind of setup.
This top-down sequencing reflects how capital actually moves. Macro forces determine which sectors attract institutional money. Sector flows determine which stocks within those sectors have the best odds of follow-through. Price action confirms when institutional accumulation is happening. The sequence, from environment to sector to stock to price, is the architecture this series teaches.
Layer 1: Understand the Market Regime
Before any other analysis, the starting question is what kind of market environment is currently active. This is not a judgment about direction. It is a classification of conditions.
Markets operate across a spectrum from full risk-on, with broad participation, growth leadership, and low volatility, to full risk-off, with defensive leadership, rising volatility, and capital preservation as the dominant priority. Between those extremes sit two transitional states: selective risk-on, where capital is flowing but participation is narrow, and selective risk-off, where caution is building beneath a stable-looking index.
Risk-On vs Risk-Off Markets Explained covers the conceptual foundation, including why the binary framing most traders use is too simple, and why the transitional states contain most of the actionable information.
Market Regime Identification Framework translates that concept into a practical classification process using observable signals: VIX levels, credit spread movements, yield curve behavior, and how the market reacts to data rather than what the data actually says. A market that holds steady after bad news communicates something different from a market that sells off on good news. The regime framework captures those behavioral signals.
| Signal | Risk-On Reading | Risk-Off Reading |
|---|---|---|
| VIX | Below 18, declining | Above 20, rising |
| High-yield credit spreads | Below 3.5%, compressing | Above 4.0%, widening |
| Advance-decline line | Rising with index | Diverging from index |
| % stocks above 200-DMA | Above 55% | Below 45% |
| Market reaction to bad news | Holds or rallies | Sells off immediately |
When signals decouple, prioritize credit spreads. A VIX spike with stable high-yield spreads typically indicates a temporary technical shock, not a structural shift to risk-off.
Regime identification does not predict what happens next. It describes the environment in which the next trade will occur, and that context determines which strategies are worth attempting.
Layer 2: Confirm Through Market Internals
Macro analysis describes what should be happening. Market internals confirm whether it actually is.
This distinction matters because macro conditions can shift before price action reflects the change. Credit markets often move first: spreads begin widening while equity indices are still holding near highs. The advance-decline line can diverge from the S&P 500 for weeks before the index acknowledges the underlying weakness. Volume patterns can reveal institutional distribution on days when price barely moves.
The Daily Market Analysis Framework covers the internals layer in depth: which breadth measures to track, what volume ratios signal accumulation versus distribution, how put-call ratios interact with VIX readings, and how to interpret divergences between index behavior and underlying participation.
Internals to monitor daily:
-
Advance-decline line direction relative to the index
-
Percentage of stocks above the 50-day and 200-day moving averages
-
Advancing volume vs declining volume ratio (above 1.5:1 confirms participation)
-
Put-call ratio (below 0.70 risk-on, above 1.00 fear-dominant)
-
High-yield credit spread direction (historically a leading indicator for equities)
When internals confirm the macro regime, the environment is aligned for structured positioning. When they diverge, the index holds steady but breadth deteriorates, that divergence is the signal that the regime may be transitioning.
Layer 3: Identify Where Capital Is Flowing
Once the regime is established and internals confirm it, the next question is which sectors are attracting institutional capital.
Sectors rotate in patterns that follow macro logic. When rates are rising and growth is slowing, capital typically moves from long-duration growth stocks toward defensive sectors. When commodities are surging and global manufacturing is expanding, energy and materials attract flows. When risk appetite is recovering after a period of stress, financials and high-beta cyclicals often lead.
The Breakout Bulletin Macro Intelligence Series maps these rotation patterns through the four-house framework (Gryffindor, Slytherin, Ravenclaw, Hufflepuff). The Daily Market Analysis Framework shows how to identify which sectors are currently receiving flows, using relative strength against the index, volume behavior on sector ETFs, and whether defensive or cyclical groups are making new highs while the broader market is flat.
Rotation signals worth tracking:
-
Sector ETF relative strength vs SPY over 5 and 20 sessions
-
New 20-day highs concentrated in defensive vs cyclical sectors
-
Volume on sector ETFs relative to 20-day average
-
Whether the rotation has persisted for 3 or more consecutive sessions (structural) vs 1–2 sessions (tactical)
Structural rotation, where multiple defensive or cyclical sectors move together over several sessions, indicates institutional repositioning. A single sector moving for one or two days is more likely noise.
Layer 4: Execute With Price as the Final Confirmation
By the time price action enters the process, most of the analytical work is complete. The regime is identified. Internals confirm it. The sector is clear. The stock is selected based on balance sheet strength, earnings revision direction, and accumulation patterns.
Price provides the trigger, not the thesis.
Prior highs and lows, the 20-day and 50-day moving averages, and volume-weighted average price zones act as confirmation points. When price reclaims a level on expanding volume, in alignment with the macro thesis and sector flow, the setup carries confirmation from multiple independent inputs.
Position sizing reflects signal quality:
| Signal Alignment | Position Size |
|---|---|
| Macro + internals + sector + price all aligned | Full size |
| 3 of 4 aligned | 60–70% of normal size |
| 2 of 4 aligned | 40–50% of normal size |
| Signals conflicting | 25% or wait |
Note: “Full size” should always be defined by your pre-set risk per trade, not by signal alignment alone.
Conflicting signals are not failures of the framework. They indicate a regime transition, where the old environment is losing strength before a new one is established. Reducing size during transitions is the structured response.
Special Case: Trade Economic Events Without Panic
Scheduled economic releases, CPI, NFP, and FOMC, are a distinct category within this framework. They are not routine market sessions. They are moments when the macro regime can shift within minutes, liquidity conditions deteriorate sharply, and the initial price move is frequently the wrong signal.
The Economic Calendar Trading Framework addresses this special case through the V.L.T. model (Volatility / Liquidity / Trend), which structures the three phases of market behavior after a major data release.
The first 5 minutes after a release, the Volatility phase, is driven by algorithms, stop hunts, and spread widening. During the Liquidity phase (roughly 5–20 minutes after the release), spreads begin to snap back to normal as market makers return, but price often remains choppy. The Trend phase (20+ minutes) is when true institutional direction becomes visible as the market permanently absorbs the data print. The actionable phase begins once the Trend phase is established, not during the initial spike. Trading the initial spike is the most common execution error around news events.
Economic calendar events also feed directly back into regime identification. A CPI print above expectations shifts the rate outlook, which immediately affects the regime classification and the sector rotation logic that follows.
How the Two Series Connect
The Breakout Bulletin Macro Intelligence Series and the Breakout Bulletin Trading Frameworks Series address different questions but feed the same process.
The Macro Intelligence Series answers: which stocks are affected by which macro forces, and why?
The Trading Frameworks Series answers: how do I identify the current environment, confirm it, and execute within it?
In practice, both are used simultaneously. The macro classification, which house does this stock belong to, determines which stocks deserve attention in the current regime. The framework process, what regime are we in, what do internals confirm, where is capital flowing, determines whether the conditions support acting on that attention.
| Question | Series | Article |
|---|---|---|
| Why did rates hurt tech today? | Macro Intelligence | Interest Rates & Growth Stocks |
| What kind of market are we in? | Trading Frameworks | Market Regime Framework |
| Which sectors are attracting flows? | Both | Daily Analysis Framework |
| How do I trade tomorrow's CPI? | Trading Frameworks | Economic Calendar Framework |
| Why is energy outperforming? | Macro Intelligence | Commodity Booms & Cyclicals |
What This Framework Is Not
This is not a trading signal service. The framework does not generate buy or sell recommendations. It does not identify stocks to purchase or sectors to avoid.
What it provides is a consistent analytical process: a way to approach the market each day with the same sequence of questions regardless of what happened the previous session. Consistency in process, applied across market cycles, is what separates structured trading from reactive trading.
Markets always contain uncertainty. The framework does not eliminate it. It organizes the available information into a sequence that reduces the number of decisions made on noise rather than signal.
Go Deeper: The Full Breakout Bulletin Trading Frameworks Series
Understand the environment:
-
Risk-On vs Risk-Off Markets Explained – The spectrum of market risk appetite
-
Market Regime Identification Framework – Classifying the current environment using VIX, credit spreads, and yield curves
Apply it daily:
-
Daily Market Analysis Framework – Combining macro, internals, and price action in a structured 5-step process
Trade specific events:
-
Economic Calendar Trading Framework – The V.L.T. model for CPI, NFP, and FOMC
Understand the macro forces driving each regime:
-
The Sorting Hat for Stocks – How macro environments map to stock groups across the S&P 500
This article is published by BreakoutBulletin for educational purposes only. It does not constitute investment advice or a recommendation to buy or sell any security. All frameworks, thresholds, and examples are provided for illustrative and educational purposes only. Past performance is not indicative of future results. BreakoutBulletin is an educational content platform and is not a registered investment advisor, broker-dealer, or financial institution.
© 2026 BreakoutBulletin | breakoutbulletin.com | All rights reserved.