
A single prompt, however well-constructed, has a ceiling. It can synthesise what you've given it and apply a defined framework to a specific dataset. What it cannot do is carry an entire research session – moving from macro environment to sector selection to stock assessment to position sizing while maintaining analytical precision at every step.
Ask a single prompt to cover that ground and you get a response that approximates everything and executes nothing precisely. AI prompt chaining solves this by turning a single analytical session into a sequence of focused steps – each building on the verified output of the prior one, the whole sequence moving from raw data to actionable position in a fraction of the time manual analysis requires.
Prompt chaining is Level 3 of the automation progression covered in Prompt Engineering and Automation for Traders. The hub overview explains how chaining connects to the prompt library and the persistent Project system.
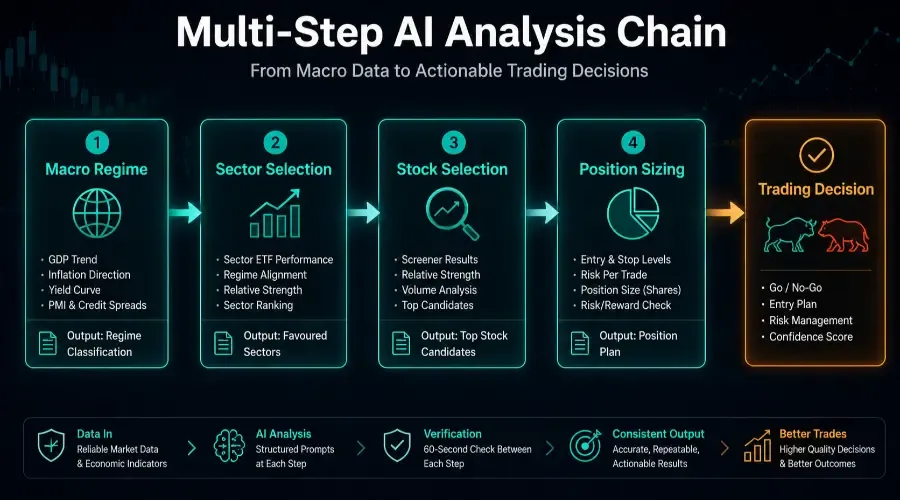
The Four-Step Chain – Core Framework for Automated Stock Research
The four-step chain covers the complete research sequence from macro context to executable position – the highest-leverage trading workflow optimisation for traders running a top-down strategy.
Step 1 – Macro Regime Classification
Input: GDP trend, CPI direction, yield curve shape, ISM PMI, credit spreads (the macro data table format covered in the macro regime post – GDP, CPI, ISM PMI, yield curve configuration, and credit spreads). Output: a specific regime classification with the indicators cited for each axis. This output frames every subsequent step. Errors here propagate through the entire algorithmic research workflow.
Step 1 of the chain macro regime classification is covered as a standalone analytical process in How to Identify Macro Regimes with AI. If you want to understand the full data inputs and the four-quadrant model before building it into a chain, that post covers the complete methodology.
Step 2 – Sector Selection Given the Regime
Input: the Step 1 regime classification plus a sector ETF performance table (the weekly ETF rotation data – 1-month and 3-month returns for the eleven SPDR sector ETFs versus SPY). Output: a ranked sector assessment – which sectors are favoured by the current regime and confirmed by the performance data, which are contraindicated, and which diverge in ways worth noting. This narrows the research universe from the entire market to one or two sectors.
Step 3 – Stock Selection Within the Favoured Sector
Input: Step 2 sector output plus screener results for the selected sector filtered by relative strength and volume. Output: the top two or three individual stock candidates ranked by relative strength, with specific reasoning for each.
Step 4 – Position Sizing and Entry Assessment
Input: the selected stock from Step 3 plus technical setup data – OHLCV table, ATR, key levels – and account parameters. Output: position size in shares, stop level, target, and sector concentration check. A complete pre-trade decision input. The chain is complete.
How to Pass Output Between Steps
The handoff between steps is where AI prompt chaining breaks down most frequently. Three practices keep handoffs clean.
Summarise, don't paste. Step 2 doesn't need the full Step 1 output – it needs the specific conclusions: regime classification, the two or three supporting indicators, any notable divergence. Two to four lines. A good handoff: "Step 1 established: expansion with disinflation regime. Positive GDP, declining CPI, constructive credit conditions. Manufacturing PMI below 50 – industrial weakness within broader expansion."
State what was carried forward explicitly. Begin each step's prompt with: "Based on the Step 1 analysis establishing an expansion-with-disinflation macro regime..." This grounds the model in what was actually established rather than what it might infer from conversation history.
Single session vs fresh session. For a standard four-step chain run in one sitting, a single conversation is fine – the handoff summaries reinforce context at each step regardless. Start a fresh session when: there's a significant time gap between steps; the conversation has grown very long and context reliability may be degrading; or a step's output significantly surprises you and you want clean framing for what follows. When starting fresh mid-chain, open with a mega-handoff: a concise summary of all prior steps' key conclusions before running the next prompt.
Chained workflows run most efficiently when the model already knows your strategy parameters and risk rules before the chain starts. How to Build a Personal Trading Assistant Using AI Projects covers how to embed that persistent context in a Project so every chain step is calibrated to your specific approach without re-stating the setup.
The Quality Control Layer – AI Research Verification
The amplification problem in multi-step AI analysis is this: any error at Step N corrupts Step N+1, N+2, and N+3. A misclassified macro regime produces a sector selection optimised for the wrong environment, which produces a stock drawn from the wrong sector, which produces position sizing applied to a chain of reasoning invalidated at the first step.
The solution is a 60-second verification checkpoint between each step. Before summarising for the next prompt, confirm: Does the regime classification make sense given the data I pasted? Is the leading sector consistent with what the ETF table actually showed? Is the selected stock in the screener output I provided?
If yes, carry forward. If no – if the output has introduced external data or produced a conclusion unsupported by the step's inputs – identify what went wrong before proceeding.
One additional check after Step 4: re-read the final position decision against the original Step 1 regime classification. AI can subtly shift its framing bullish or bearish across successive steps without making a clear factual error. This final tone-drift check confirms the chain's conclusion is still grounded in the data that opened it.
November 2024 – A Four-Step Chain Walkthrough
Note: this walkthrough uses realistic but synthetic data to demonstrate the chain structure. It is not a live trade log.
The context: mid-November 2024, post-election environment, two Fed rate cuts completed, AI infrastructure theme active. A trader wanted to assess whether the macro environment supported entering a semiconductor position.
Step 1 classified the regime as expansion with disinflation – positive GDP at +2.8%, CPI at 2.6% declining, credit spreads at 265 basis points below stress threshold, yield curve re-steepened positively. Manufacturing PMI at 46.5 flagged industrial weakness within the broader expansion. Verification: consistent with all pasted figures. Carried forward.
Step 1 of the chain macro regime classification is covered as a standalone analytical process in How to Identify Macro Regimes with AI. If you want to understand the full data inputs and the four-quadrant model before building it into a chain, that post covers the complete methodology.
Step 2 identified Technology (XLK, +8.4% one-month vs SPY +5.2%) and Financials (XLF, +9.8%) as top sectors by combined regime alignment and momentum. Primary sector: Technology, sub-sector semiconductors. Verification: XLK figures matched pasted ETF table. Carried forward.
Step 2 sector selection given the regime is covered as a full analytical process in How to Run Sector Rotation Analysis with AI, including the 11 SPDR ETF performance table, the rotation signal thresholds, and how to cross-reference the ETF data against the macro classification from Step 1.
Step 3 ranked NVDA, MRVL, and AVGO as top candidates. NVDA flagged for short-term extension – its 5-day return represented 37% of the 20-day move. AVGO selected as primary candidate: strong 14.8% 20-day outperformance, no extension concern, sufficient liquidity. Verification: all figures matched screener output. Carried forward.
Step 4 ran the position sizing and compliance check. At 2% risk on a $75,000 account with a $9.40 stop distance, the position size was 159 shares. Two conditions failed: combined semiconductor exposure (existing NVDA plus new AVGO) reached 42% of account, exceeding the 30% maximum. Risk-reward at 1.83:1 fell below the 2:1 minimum. Overall: NO-GO.
The chain surfaced a concentration problem and a risk-reward gap before the trade was entered. The trader reduced the NVDA position to bring semiconductor exposure within the 30% threshold and adjusted the target to achieve 2:1. The adjusted chain passed. The trade proceeded.
That's what sector rotation AI and position sizing automation produce together – not analysis for its own sake, but a sequenced, verified process ending in a specific, compliance-checked decision.
Building the Chain Into Your Workflow
Even v1 versions of your prompt templates can be chained – the handoff summaries and verification checkpoints catch most issues that an unrefined template introduces. Start with your highest-frequency chain, run it consistently, and refine each step through the three-use rule from the prompt library post. The individual templates become the steps. The handoff summaries become the connective tissue. The verification checkpoints become the quality control layer that keeps the chain reliable.
A well-built four-step chain running on a refined prompt library produces research quality that individual prompts cannot match and efficiency that manual analysis cannot approach.
Q&A: Prompt Chaining for Traders
Q: Why not use one master prompt to handle the entire research session?
Because of the breadth-versus-depth trade-off at the core of multi-step AI analysis. A single prompt asking for macro regime, sector rotation AI output, stock selection, and risk sizing simultaneously forces the model to approximate each task. Chaining forces rigorous framework application at each step, ensuring the final position sizing is grounded in accurate macro and sector data rather than a compressed generic summary. Automated stock research compounds in quality precisely because each step is scoped tightly.
Q: How do I handle a handoff where the AI output contradicts my experience?
Never ignore a divergence, but treat it as an AI research verification exercise. First run the 60-second sanity check: does the output match the data you provided? If the data is correct but the conclusion is surprising, the model may be surfacing a structural shift you hadn't noticed – which is the most valuable output a chain can produce. If the data is incorrect, tighten your prompt constraints. Never force the model to agree with you; force it to explain its reasoning based on what you provided.
Q: Does prompt chaining require coding skills?
Not for the workflow described here. It is a logical process of synthesis and structured handoff. While developers use APIs to automate these chains at scale, any trader can build a high-precision algorithmic research workflow using copy-paste, a versioned prompt library, and a clear verification checklist. The specialisation required is discipline – verifying the data at every link in the chain – not technical skill.