
Quick Summary: Market Internals Trading Framework
Market internals are the “X-ray” of the stock market.
Price shows direction. Internals show conviction.
Professionals use internals to identify hollow rallies and capitulation bottoms.
The VIX (Fear Gauge):
Measures implied volatility.
VIX > 30: Extreme panic → often a buying opportunity
VIX < 12: Extreme complacency → risk of correction
Put/Call Ratio (PCR):
Measures sentiment.
PCR > 1.0: Bearish sentiment → contrarian bullish signal at extremes
Market Breadth (A/D Line):
Measures participation.
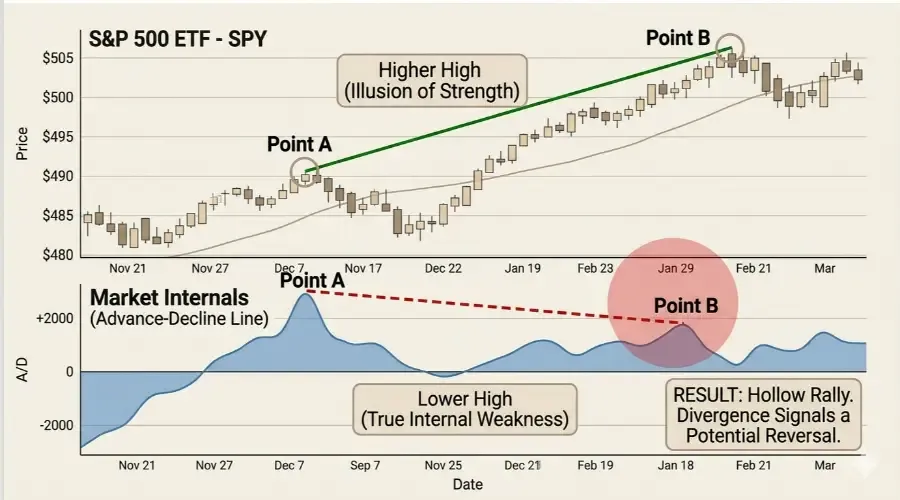
Healthy market → price + A/D both rising
Weak market → price rising, A/D falling (divergence)
The I.N.T.E.R.N.A.L.S. Model:
A structured scoring system to identify risk vs opportunity
Golden Rule:
Never trade a single signal.
Trade confluence (VIX + PCR + Breadth)
Most traders follow price. Institutions follow internals.
But even this only makes full sense when viewed within a structured system that connects macro conditions, internals, and execution, as explained in the daily market analysis framework combining macro, internals, and price action.
You see the market going up.
They see whether that move is real or fragile.
That difference defines your edge.
What is Market Internals Trading?
Market internals trading uses indicators like VIX, Put/Call Ratio, Advance-Decline Line, and TICK/TRIN to measure market strength beneath price.
Instead of asking “Is price going up?”, you ask:
“Is this move supported by participation, sentiment, and liquidity?”
complete stock market technical analysis guide.
This approach is part of a broader process used by professional traders to analyze markets before making decisions, as outlined in the pre-market routine used by macro traders.
Why Market Internals Matter More Than Price
Price shows outcome.
Internals show quality of participation.
A rising market can be strong or weak — price alone cannot tell.
Key Insight:
Divergence between price and internals often signals reversals early.
Understanding this difference becomes much clearer when placed within the broader market environment, as defined in the market regime identification framework.
How to Read the VIX Index (Fear vs Opportunity)
The VIX measures hedging demand, not direction.
Key Levels:
VIX > 20: Rising fear
VIX > 30: Panic → potential bottom
VIX < 12: Complacency → risk building
Advanced Insight (Alpha):
If the market is falling but VIX is not rising, it signals a “Vol Crush” — a hidden weakness where participants are not hedging. This often leads to sharp downside moves later.
Key Insight:
High VIX = opportunity
Low VIX = hidden risk
Volatility signals like VIX are rarely meaningful in isolation and are best interpreted alongside macro drivers such as interest rates and liquidity conditions, as explained in how rising interest rates affect growth stocks.
Put/Call Ratio Explained for Traders
PCR measures options sentiment.
PCR > 1.0: Bearish sentiment
PCR < 0.7: Bullish sentiment
Important Distinction (Alpha Tip):
Equity PCR: Reflects retail sentiment (“dumb money”)
Total/Index PCR: Includes institutional hedging
Extreme PCR readings often act as contrarian signals.
Key Insight:
When everyone is bearish, the market is often near a bottom.
Global liquidity and currency strength also influence how these signals behave, especially during periods of dollar strength, as explained in the impact of a strong dollar on the S&P 500.
Market Breadth Indicators - The Truth Behind the Index
Advance-Decline Line Strategy
Tracks number of advancing vs declining stocks.
Rising A/D Line: Strong participation
Falling A/D Line: Weak market
Breadth Divergence:
Index up + A/D down = fragile rally
% of Stocks Above Moving Averages
65% above 50 MA: Strong trend
<50% above 200 MA: Weak structure
Key Insight:
Breadth shows whether the market is broad or narrow
These participation shifts often reflect deeper capital movement across sectors, which becomes more evident during commodity-driven cycles, as explained in the commodity cycle and its impact on cyclical stocks.
Intraday Internals - TICK and TRIN
NYSE TICK:
+1000 → strong buying (often exhaustion)
-1000 → strong selling (often bounce zone)
TRIN (Important Clarification):
Below 1.0 → Bullish (buying pressure)
Above 1.0 → Bearish (selling pressure)
This inverse nature confuses many traders.
Key Insight:
Extreme readings often signal reversals, not continuation
The I.N.T.E.R.N.A.L.S. Framework - Institutional Scoring System
Professionals don’t guess.
They score the market.
The framework evaluates:
VIX (fear)
PCR (sentiment)
A/D Line (breadth)
Participation
TICK/TRIN (pressure)
News context
Volume conditions
Price levels
Session type
Scoring Guide
0–2 → Strong bullish environment
3–5 → Neutral / mixed
6+ → High-risk environment
Key Insight:
This framework filters bad trades before they happen
How to Combine Market Internals for High-Probability Trades
Single indicators fail.
Confluence works.
Bullish Setup:
High VIX + High PCR + Strong A/D + Positive TICK
→ Mean-reversion opportunity
Bearish Setup:
Low VIX + Low PCR + Weak A/D + Negative TICK
→ Fragile rally, downside risk
Key Insight:
The most dangerous market is not fearful.
It is complacent and weakening
This idea of combining multiple signals into a single decision process is a core principle of the daily market analysis framework used by professional traders.
The 5 Biggest Mistakes in Market Internals Trading
Using VIX as direction
Ignoring PCR context
Trading single indicators
Ignoring low-volume distortions
Expecting precise timing
Key Insight:
Internals are risk filters, not signals
When Market Internals Fail
News events override signals
Low liquidity creates noise
Extreme volatility distorts readings
Algorithmic trading creates false extremes
Key Insight:
Always combine internals with price structure
BreakoutBulletin Take - Trade Like Institutions
Retail traders confirm trades using internals.
Institutions filter trades using internals.
That is the difference.
Before entering any trade, ask:
“Does the internal environment support this move?”
This type of structured thinking begins well before the trade itself, during the preparation phase outlined in the pre-market routine used by macro traders.
Key Takeaway
Market internals trading is not about more indicators.
It is about better decisions.
Use:
VIX → fear
PCR → sentiment
A/D Line → participation
TICK/TRIN → timing
Trade confluence, not signals
complete stock market technical analysis guide
Frequently Asked Questions:
What is a good VIX level to buy stocks?
A VIX between 20–30 signals fear and potential opportunity.
Above 30 indicates capitulation and often marks short-term bottoms.
Below 12 suggests complacency and risk of correction.
How do you interpret a Put/Call Ratio (PCR) above 1.0?
PCR above 1.0 shows bearish sentiment.
At extremes (1.2+), it becomes a contrarian bullish signal.
This often leads to short squeezes as the market is “too short.”
Does the Advance-Decline Line predict market tops?
Yes, through breadth divergence.
If price makes a new high but A/D does not, the rally is weak and narrow.
This often precedes market tops.
Which market breadth indicators are most reliable?
The most reliable are:
Advance-Decline Line → long-term health
% Above 200 MA → structural trend
NYSE TICK → intraday timing
Together, they provide a complete market view
DISCLAIMER:
This article is for informational and educational purposes only and does not constitute financial, investment, or trading advice. You are solely responsible for your own investment decisions and should consult a licensed financial professional before acting on any information in this post.