
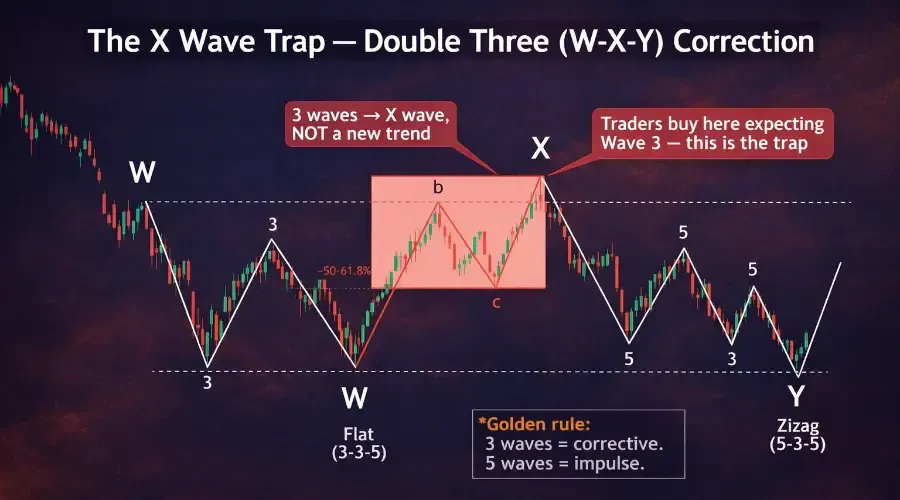
Simple corrections such as zigzags and flats are relatively straightforward once the structure is understood. Complex corrections, however, are where most traders lose their count, misread direction, and enter positions that appear logical but are structurally invalid.
Before understanding complex corrections, you should understand basic corrective structures:
Corrective Waves: Zigzag vs Flat Explained
These are the environments where markets move sideways, extend in time, and create false signals that resemble trend continuation while remaining corrective beneath the surface.
This guide focuses on the structures that create the most confusion - double threes (W-X-Y), triangle formations, and the X wave trap, which repeatedly leads traders to mistake corrective rallies for the beginning of a new impulse.
The core principle is simple but non-negotiable: an X wave subdivides into three waves, while a true impulse subdivides into five. Every decision must begin with this distinction.
Why Most Traders Lose Their Count Here
The difficulty does not lie in recognizing price movement, but in correctly classifying its structure. Complex corrections often unfold slowly, overlapping prior price action and consuming significantly more time than impulse waves, which creates the illusion of trend transition.
As a result, traders interpret temporary rallies as breakouts, particularly during X waves, where price moves in the direction of the larger trend but lacks the internal structure required to sustain continuation.
The mistake is not directional - it is structural.
To validate whether your structure is correct: Elliott Wave Rules vs Guidelines
The Double Three Structure (W-X-Y)
What is a Double Three
A double three is a combination of two corrective patterns connected by an intervening wave, forming a broader, more time-consuming correction that typically unfolds sideways rather than directionally.
The structure consists of three components:
- Wave W → First corrective pattern (zigzag or flat)
- Wave X → Connecting wave in the opposite direction
- Wave Y → Second corrective pattern
Each of these components remains corrective in nature, meaning the entire structure continues to behave as a three-wave sequence at the higher degree.
Internal Structure
- Wave W → A-B-C (3 waves)
- Wave X → Always 3 waves (never 5)
- Wave Y → A-B-C (3 waves)
This is the defining characteristic: there is no impulse inside a double three at the degree being analyzed.
Practical Interpretation
In a bullish market correction, Wave W declines, Wave X rallies partially, and Wave Y declines again, often terminating near or slightly beyond the end of Wave W.
The result is not a strong directional move, but a time-consuming consolidation, which exists to correct the prior trend without significantly reversing it.
The Most Common Mistake
The most frequent error occurs during Wave X. Traders observe the rally, assume it is the beginning of a new impulse, and attempt to position for continuation. This behavior is closely related to false breakout traps: B-Wave Trap: False Breakout Explained
However, Wave X is structurally limited. It subdivides into three waves and cannot evolve into a five-wave impulse.
Three waves indicate continuation of correction, not the start of a trend.
To understand how real trends actually form: Elliott Wave Motive Wave Strategy (Wave 3 Guide)
The Triangle Structure
What is a Triangle
Triangles are complex corrective patterns composed of five waves labeled A-B-C-D-E, each subdividing into three waves and alternating in direction.
They typically appear as Wave 4 and represent a phase of contraction, where price compresses between converging trendlines before expanding into the next impulse.
Key Characteristics
- Five internal waves (A-B-C-D-E)
- Each wave subdivides into three waves
- Trendlines converge (in most cases)
- Momentum contracts during formation
Triangle Types and Behavior
Contracting triangles are the most common and form with converging boundaries. Expanding triangles are rare and less reliable. Running triangles appear in strong trends and signal continuation. Barrier triangles, where one boundary remains horizontal, often precede powerful breakouts due to built-up pressure.
The Thrust: Where Opportunity Exists
The most important feature of a triangle is not the structure itself, but the move that follows it.
The thrust is the sharp directional move that occurs after Wave E completes. This is typically the beginning of Wave 5 and often unfolds with strong momentum and minimal pullback.
The minimum target can be estimated by measuring the widest part of the triangle (distance between Wave A and Wave B) and projecting that distance from the end of Wave E. To project these targets precisely: Fibonacci Targets for Wave 3, 4 & 5
Real-Time Rules for Identifying Triangles
- Confirm five alternating waves (A-B-C-D-E)
- Ensure at least two touches on each trendline
- Expect contraction in both price range and momentum
- Avoid labeling a triangle if structure is unclear
If these conditions are not met, the pattern is likely not a triangle but a range or incomplete correction.
Time Behavior in Complex Corrections
Time is often a more reliable signal than price in identifying complexity.
If a correction is taking significantly longer than the prior impulse wave, especially if it extends beyond twice its duration, the market is likely forming a complex structure such as W-X-Y or a triangle rather than a simple zigzag or flat.
This is where patience becomes a trading edge. Entering too early inside a complex correction leads to repeated stop-outs and misaligned positioning.
The X Wave Identification Framework
The X wave is the most deceptive component of complex corrections and requires strict criteria for identification.
Three characteristics define it:
- Structure → Always three waves, never five
- Retracement → Typically 50% to 61.8% of Wave W
- Volume → Often contracts relative to Wave W
To understand how basic corrective structures behave: Corrective Waves: Zigzag vs Flat Explained
If a rally meets these conditions, it is highly likely to be an X wave rather than the beginning of a new trend.
Decision Logic: Avoiding the X Wave Trap
- If the move subdivides into three waves → Treat as corrective
- If volume is declining during the rally → Do not assume breakout
- If retracement is near 50–61.8% → Expect continuation into Wave Y
- If structure is unclear → Wait for completion rather than forcing a count
The objective is not to predict every movement, but to avoid entering trades where structure does not support continuation.
Trading the Triangle Breakout (Wave 5 Setup)
Once a triangle completes, the breakout phase provides one of the most reliable opportunities in Elliott Wave analysis.
Post-Breakout Checklist
- Price breaks above or below the triangle boundary with conviction
- Volume expands relative to recent averages
- Target is projected using triangle width
- Momentum supports continuation
Risk Management
- Invalidation level → Return into Wave E zone
- Watch for divergence → If momentum weakens, reduce exposure
When to Skip a Trade
There are situations where the correct decision is inaction.
- Structure is unclear or overlapping excessively
- X wave count cannot be confirmed
- Correction has extended far beyond expected duration
- No clear five-wave breakout structure
Avoiding low-quality setups is often more valuable than identifying high-quality ones.
Frequently Asked Questions
Why do X waves trap traders
Because they move in the direction of the trend while remaining corrective, creating the illusion of a breakout without the structure to sustain it.
What confirms a triangle breakout
A decisive break of the trendline with volume expansion and follow-through price action.
How do I differentiate X wave vs new impulse
By counting internal structure: three waves indicate correction, five waves indicate impulse.
Key Takeaways
- Complex corrections follow structured patterns such as W-X-Y and triangles
- The X wave is the most common source of false breakouts
- Three-wave structure signals correction, not trend
- Triangle breakouts often lead to strong Wave 5 moves
- Time duration is a key indicator of complexity
Next Step in the Framework
Now that you understand how complex corrections extend and trap traders, the next step is learning how to confirm whether a move is strengthening or losing momentum.